
Long-Term Average Spectrum
|
Available in VoceVista Pro
The Long-Term Average Spectrum is only available in VoceVista Pro. |
This page is about using the LTAS through the selection and through markers. Its theoretical background is explained at LTAS background.
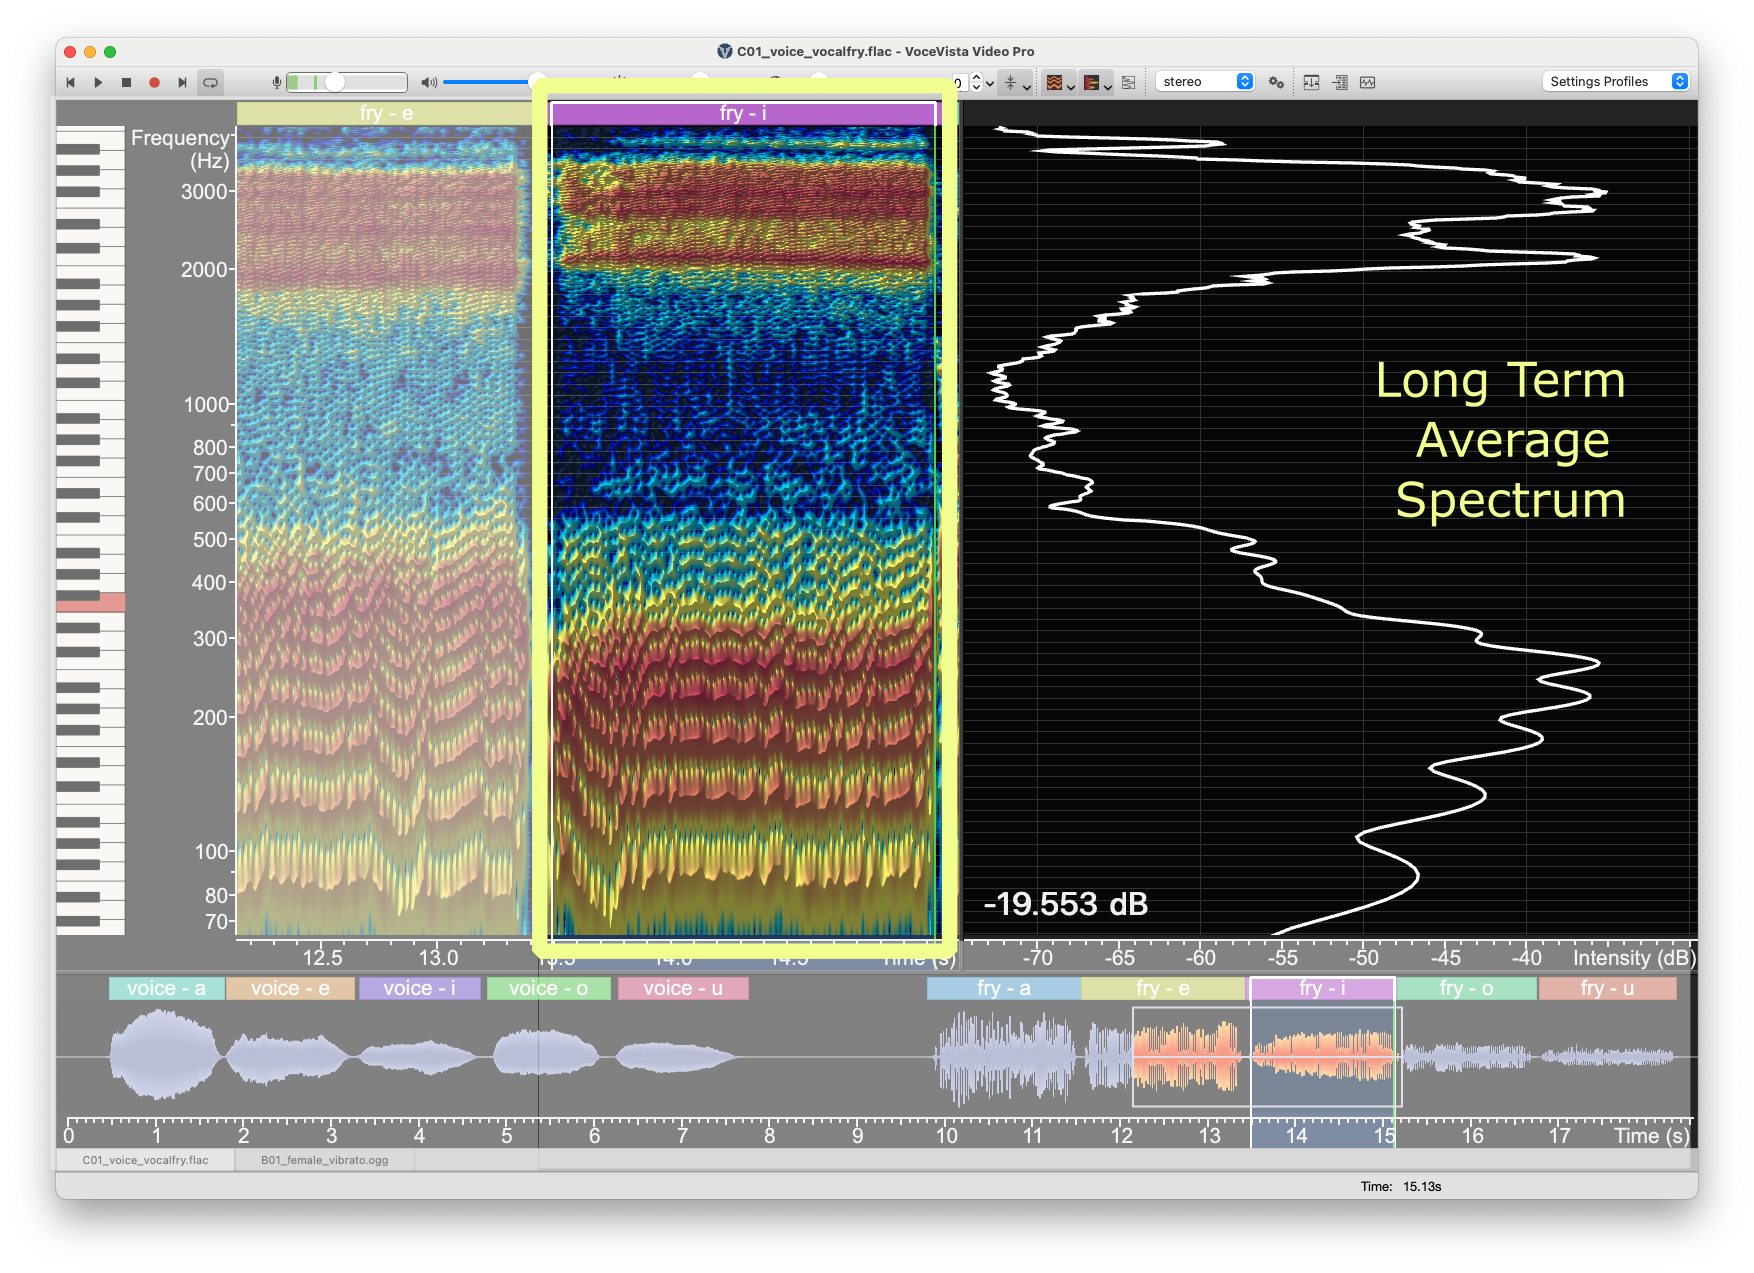
There may be times when you are anlayzing a file or a selection of a file (or two files) that you want to have a longer term view of what is happening in the signal rather than just the point in time you get when you click in the spectrogram.
The long-term average spectrum (LTAS) feature enables you to select part of a file, or the complete file, and let the application determine what the average values are that appear in the spectrogram. This can be useful in many ways giving you the ability to:
-
view a more stable signal over time
-
better identify the resonance frequencies that make up a signal — for example, the singer’s formant cluster around 2.5 - 3.5 kHz
-
compare sections of a file
-
compare sections of different files
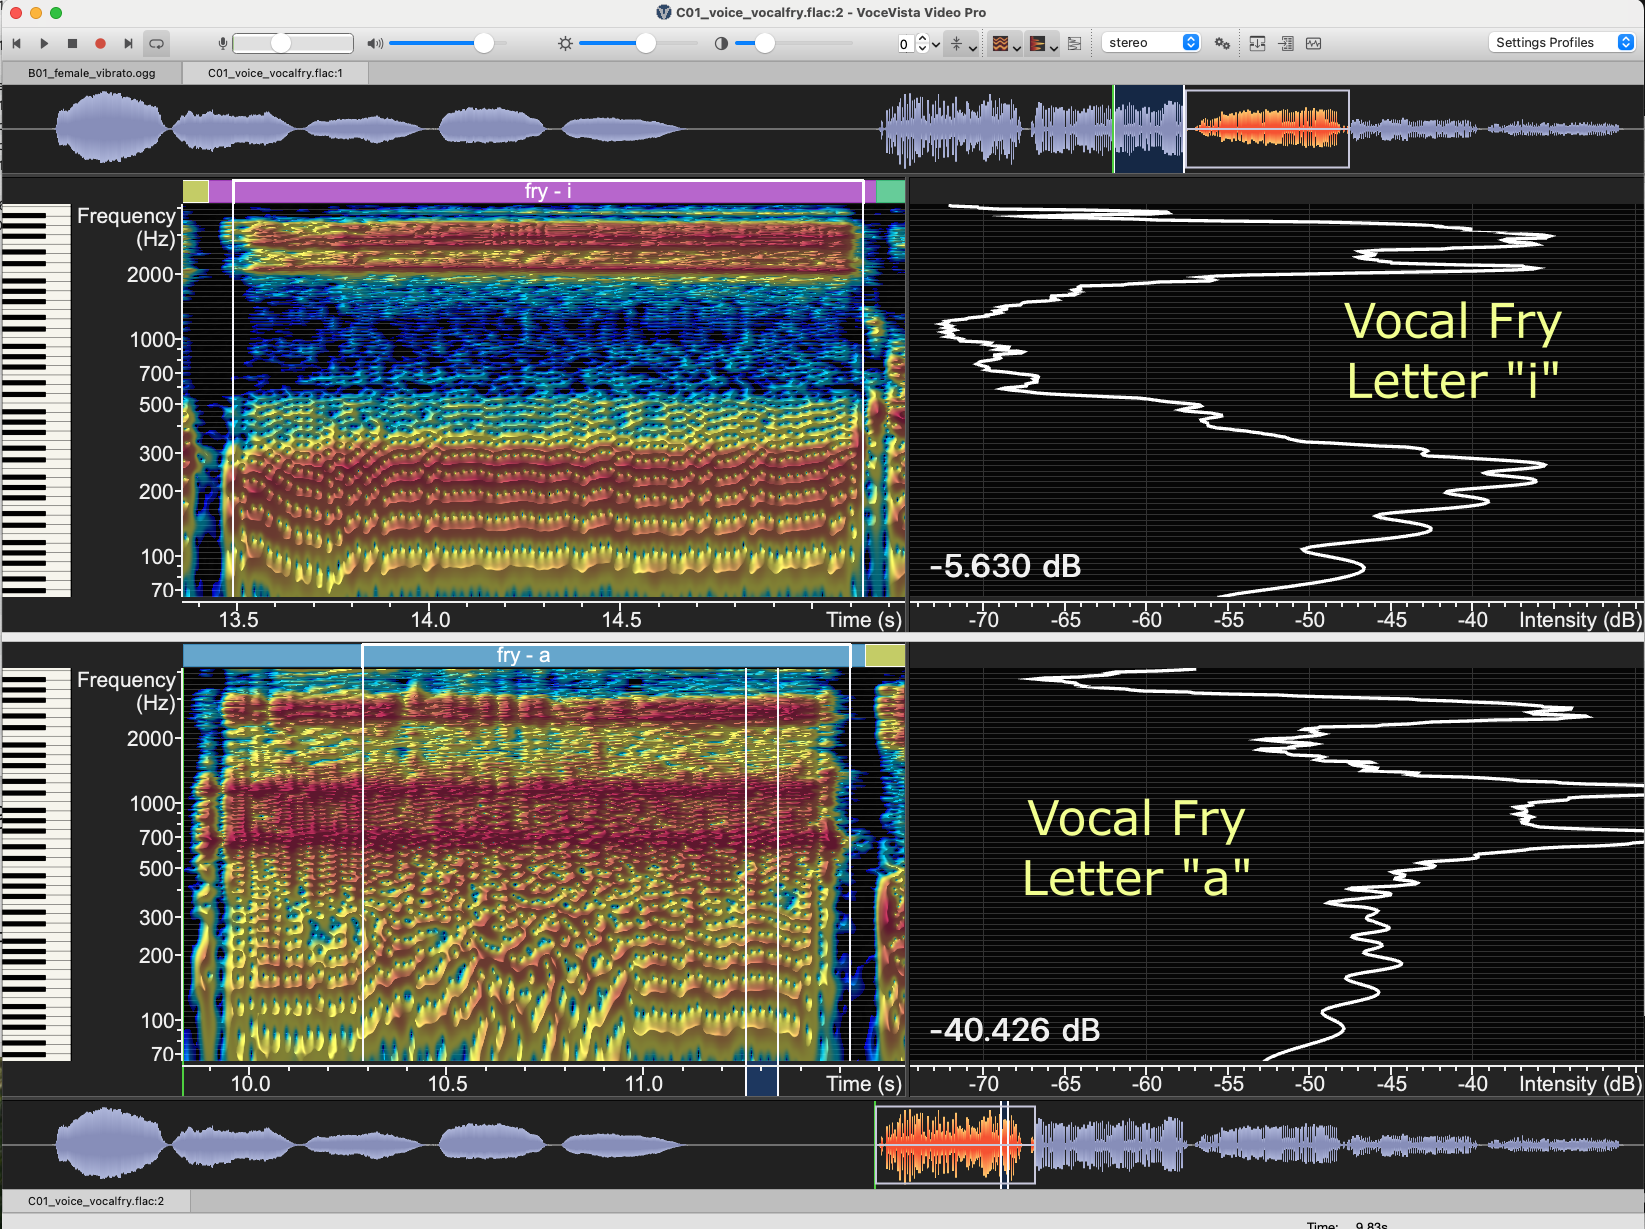
The following image shows how you can display the LTAS for two different sections of the same file, or two different files, to easiy analyze differences. Note how the top image (vocal fry of the letter "i") has much stronger resonances around 260Hz, 2000Hz and 3000Hz while the bottom (vocal fry of the letter "a") has its two strongest signals at around 700Hz 1150Hz.
View the long-term average spectrum:
-
Select a portion of the file in the spectrogram or press Command/Control + A to select the entire file. You can adjust your selection by clicking and dragging the borders or selecting to enter precise time values.
-
Click the LTAS button on the toolbar OR

-
Select
Reset the long-term average spectrum:
When you no longer want to view the LTAS, select .
Note If you have selected the option to syncronize the LTAS with the selection (see below), you do not have to perform this step. Simply click anywhere in the spectrogram.
Syncronize the long-term average spectrum with selection:
By default, the LTAS is not synchronized with what you have selected in the spectrogram. Every time you change your selection, you have to press the press the LTAS button or select to update the LTAS.
You can change this setting so that the application updates the LTAS every time you modify what you have selected in the spectrogram. You have two options to set this:
-
Select OR
-
On the Settings window, select Pointer & Selection and then select/de-select Sync Average Spectrum with Selection