
Colormap Editor
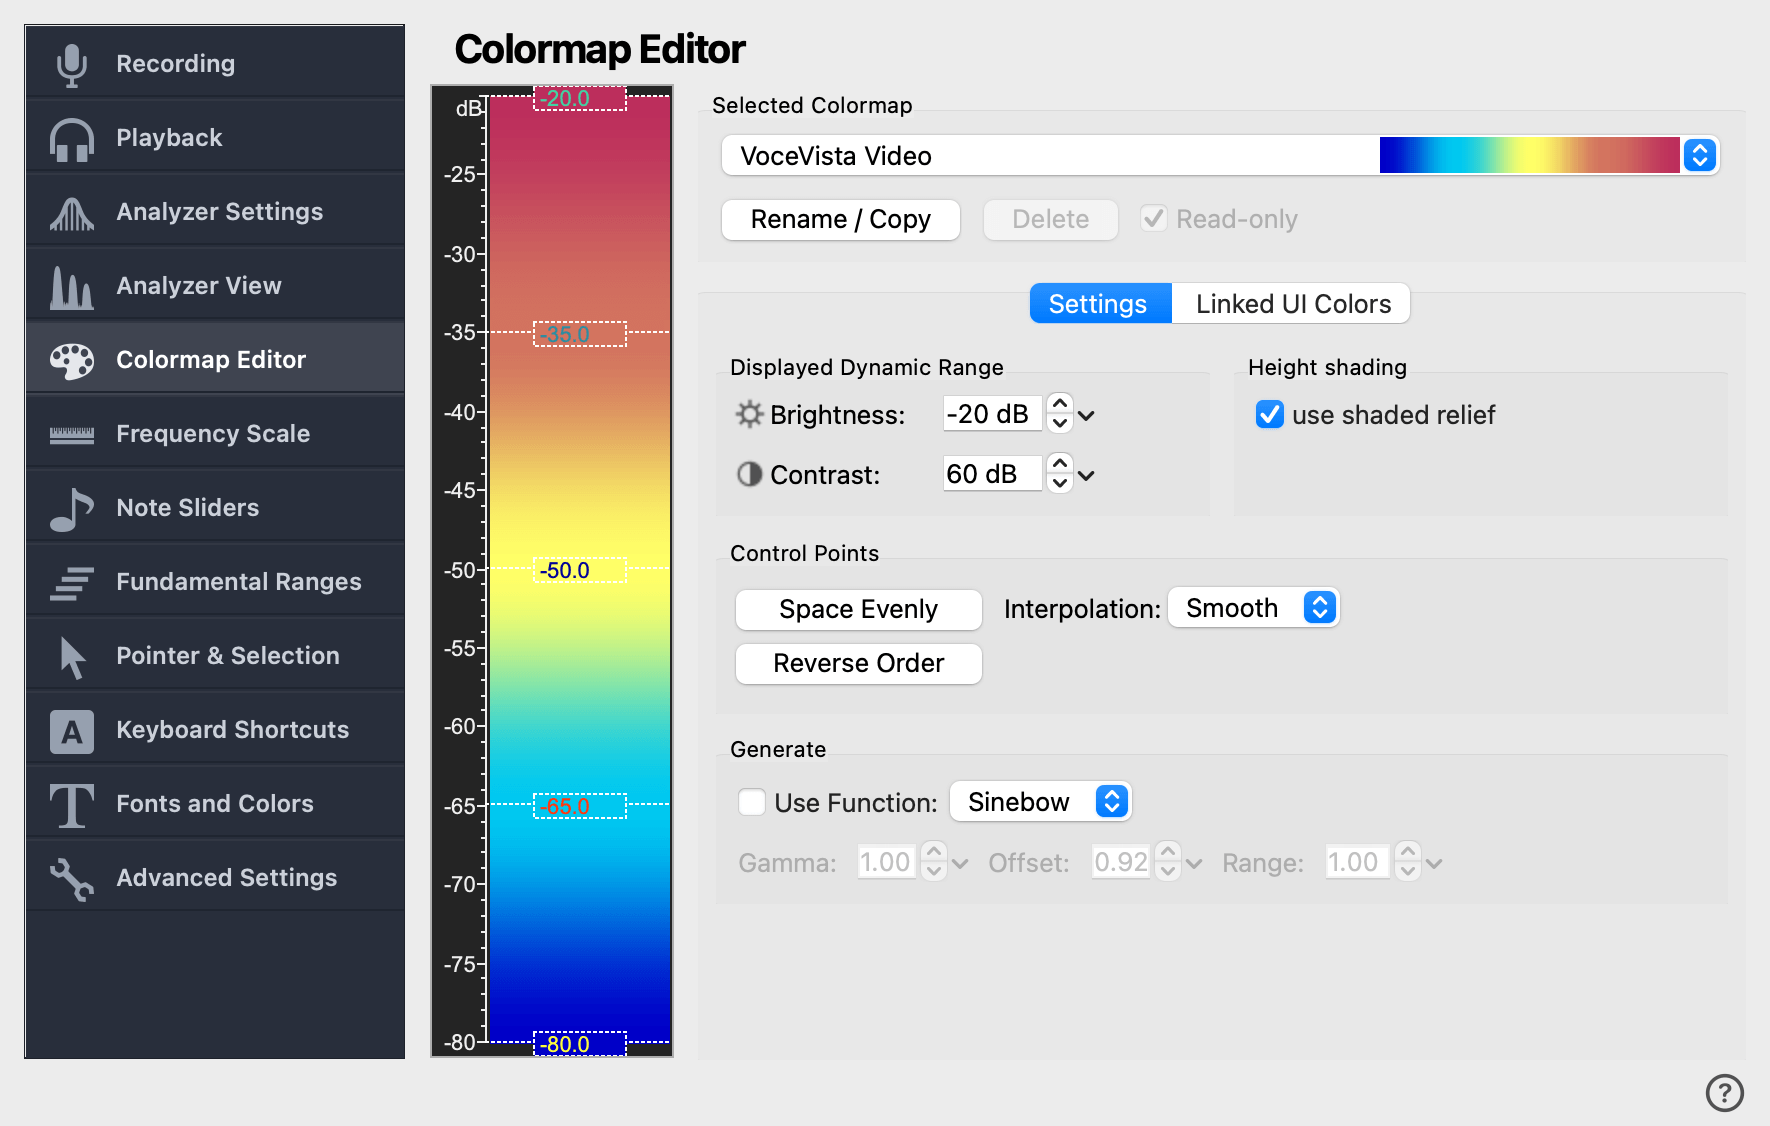
The Colormap Editor configures how the analyzer maps signal intensity to color. You can pick a stock colormap, modify its control points, generate a new colormap from a mathematical function, or override the linked UI colors (background, axes, …) just for this colormap.
Selected Colormap
The combo at the top of the page selects the active colormap. Three buttons next to it manage the colormap library:
- Rename / Copy
-
Save the current colormap under a new name. Useful for creating a user-defined copy of a built-in colormap before customizing it.
- Delete
-
Delete the currently selected colormap. Built-in colormaps cannot be deleted.
- Read-only
-
Mark the current colormap as read-only to prevent accidental changes or deletion.
Control Point Editor
The colored field on the left of the dialog shows which colors represent which intensity. Colors are interpolated between the control points marked along the gradient. You can move and edit the control points with the mouse, or create new ones by double-clicking into empty space:
| Mouse action | Command |
|---|---|
Click + Drag control point |
Move control point |
Shift + Click + Drag control point |
Move control point with more precision |
Double-click control point |
Set color |
Right-click control point |
Open context menu (set color or delete point) |
Double-click empty space |
Create new control point |
| The lowest control point is always rendered as the background color of the Analyzer View. To change it, use the Fonts and Colors page or the Linked UI Colors tab below. |
Space Evenly
Arrange all control points so they have the same distance from each other. Useful after you have changed the number of control points and want them spread cleanly across the gradient.
Reverse Order
Reverse the order of the control points so the high-intensity colors are at the bottom and vice versa. This inverts the appearance of the spectrogram and can be a quick way to audition a new color scheme.
Interpolation
How colors transition between control points:
- None
-
Hard color boundaries between control points. Each segment is a single solid color.
- Linear
-
Straight gradients between control points (the most common choice).
- Smooth
-
Cubic interpolation. Slightly softer transitions than linear, useful on colormaps with widely spaced control points.
A related but separate setting, Smooth Spectrogram Colors, controls whether the spectrogram itself smooths between adjacent samples. The Interpolation combo here only governs the colormap gradient.
Displayed Dynamic Range
The range of intensities mapped to the colormap, in decibels (dB). 0 dB is the loudest possible sine wave at the recording’s sample format (a 16-bit recording can theoretically reach about 96 dB of dynamic range). On the spectrogram it is usually better to narrow the displayed range to suppress noise and bring out the signal.
The same two values can also be set with the dynamic-range sliders on the toolbar — useful for tuning contrast on the fly.
Generate
Instead of placing control points by hand, you can generate the entire colormap from a mathematical function. The controls in this group are disabled while Use Function is unchecked, and the Control Points group above is disabled while it is checked.
Use Function
When checked, generate the colormap from the function below instead of the manual control points. Switching this off again preserves the control points you previously placed.
Generator Function
The function used to produce the colormap. Sinebow combines sine waves on each color channel to produce a continuous rainbow.
Gamma
Gamma exponent applied to the generator function. Values below 1 brighten the colormap; values above 1 darken it.
Linked UI Colors
This tab opens an editor similar to the Fonts and Colors page, but every change is local to the current colormap. For example, the spectrum background color is normally the global Analyzer View background; with Linked UI Colors you can override it (e.g. white) just for this colormap, and similarly tune the cursor lines, axis labels, and other UI colors so they read well against the chosen gradient.
Linked UI Colors are saved with the colormap, so a user-defined "high-contrast" colormap can carry its own background and axis colors without disturbing the global theme.