
Analyzer Settings
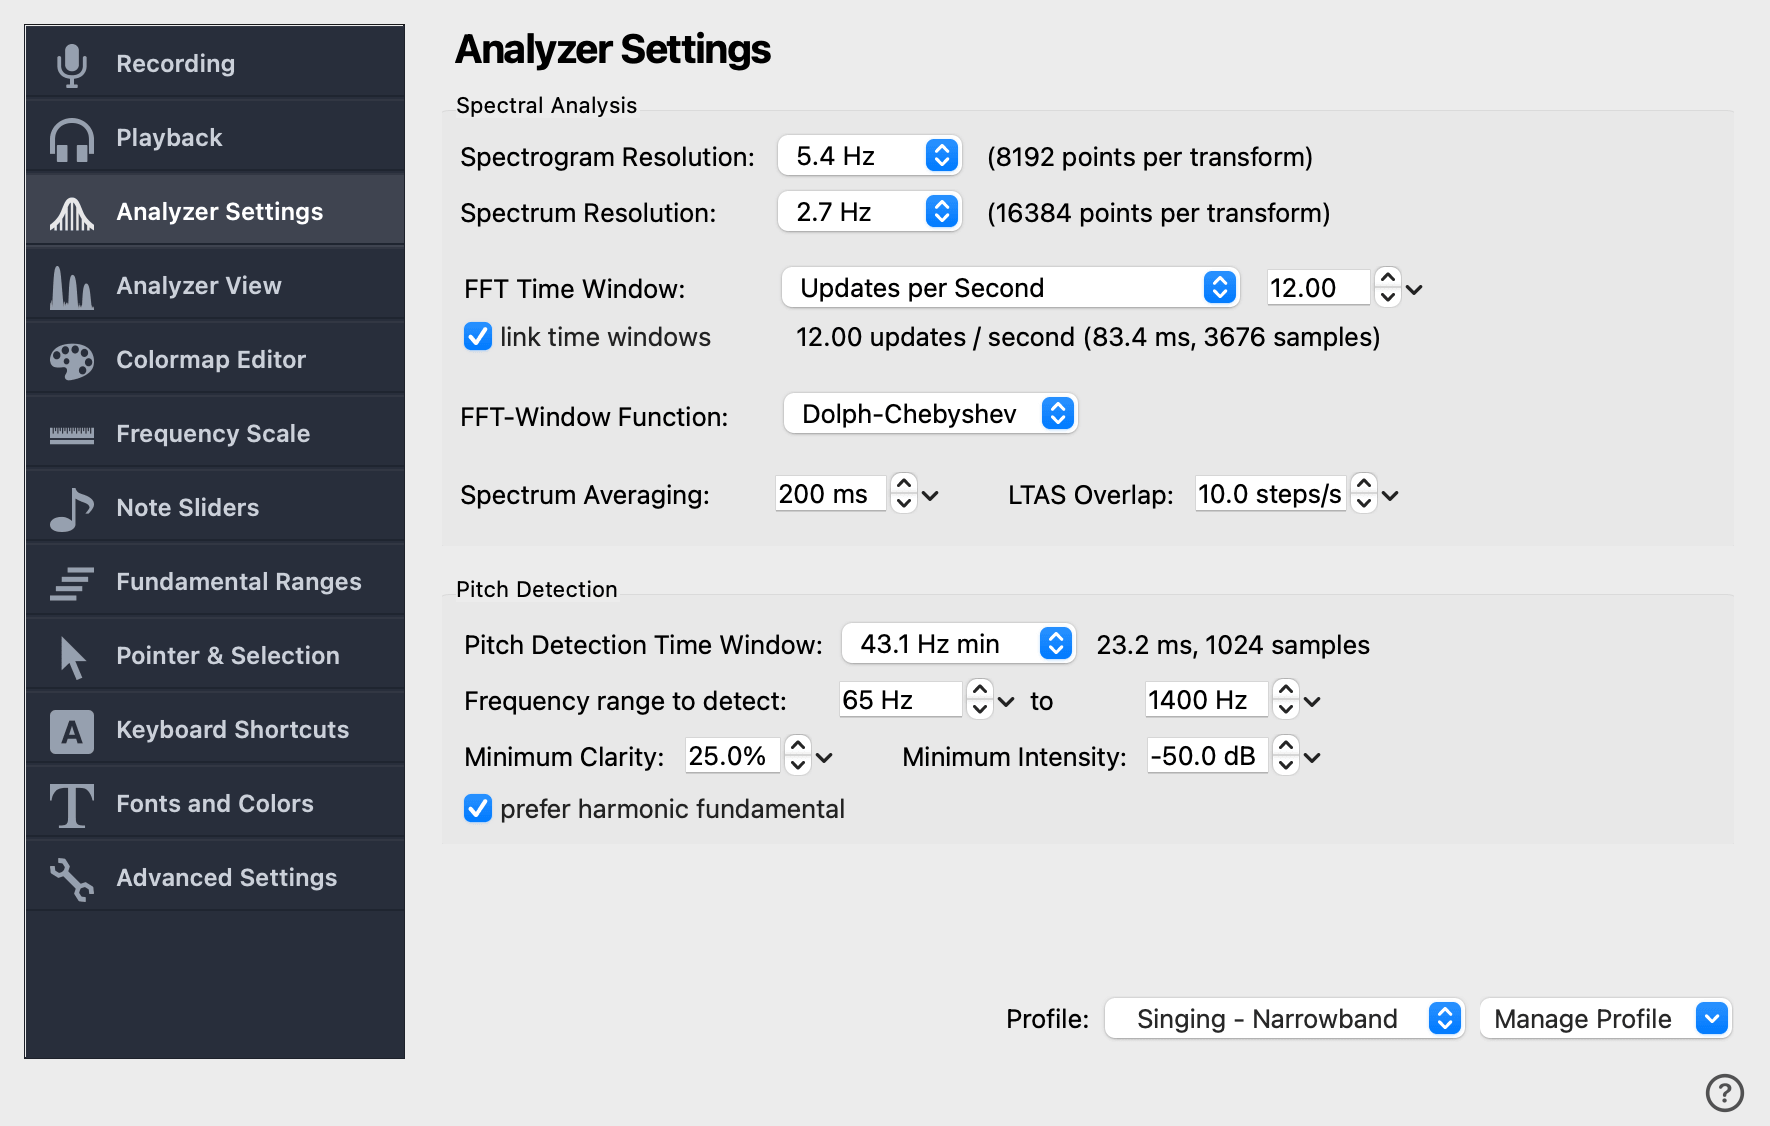
The Analyzer Settings page controls how VoceVista extracts information from the audio signal. It governs the frequency and time resolution of the spectrum and spectrogram, the parameters of the pitch detection algorithm, and the profile that bundles all of these settings together.
VoceVista runs two independent analyses on the signal. The Fast Fourier Transform (FFT) computes the Spectrum — the intensity of each frequency component. A separate pitch detector computes the Fundamental Pitch. The two methods are fully independent and have their own controls on this page.
|
The sampling rate is set on the Recording Settings page. Most values on this page — frequency resolutions, time windows, pitch limits — depend on it: lowering the sampling rate can sharpen FFT frequency resolution, while the pitch detector works best at 44100 Hz or higher (and the EGG at 48000 Hz). |
Spectral Analysis
The Spectral Analysis section configures the FFT and the time window over which it runs.
Frequency Resolution
The frequency resolution is the smallest difference (in Hz) between two frequencies that the analyzer can distinguish. Internally this is controlled by the FFT size — the number of points fed to each transform — but the dialog presents it as a frequency value in Hertz.
For a broader overview of what high FFT resolution unlocks and how it relates to sampling rate and microphone bandwidth, see the high-resolution audio spectrum analyzer page.
Spectrum Time Window
The time window determines how much audio is folded into each FFT update — and therefore the trade-off between time resolution and frequency accuracy. A longer window improves frequency accuracy; a shorter window shows faster temporal changes.
The dropdown selects how you specify the window:
- Updates per second
-
How many spectrum updates per second (e.g. 12). Larger values mean a shorter window and better time resolution.
- Milliseconds
-
The duration of the analysis window in milliseconds (e.g. 83 ms).
- Maximum Frequency Resolution
-
Automatically use the longest possible window for the selected frequency resolution. This pins the analyzer to the highest frequency accuracy your FFT size allows.
For example, with a 44100 Hz sampling rate and an FFT size of 8192 points, the maximum window is approximately 185.8 ms — about 5.4 updates per second.
link time windows
When checked, the spectrogram and the short-term spectrum share the same time window. Uncheck to set the spectrum time window independently from the spectrogram, which is useful when you want high temporal precision in the Short-Term view while keeping the spectrogram at a coarser window.
Spectrum Averaging
The short-term spectrum is averaged over this sliding time window during recording and playback to reduce flickering. Shorter durations make the spectrum more responsive to sudden changes but flicker more; longer durations are more stable but slower to react.
LTAS Overlap
The Long-Term Average Spectrum (LTAS) is computed by averaging many spectral slices taken across a selected time range. This control sets how many slices per second are taken. Higher values yield smoother LTAS results at the cost of more computation.
FFT Window Function
The FFT method requires its input to be filtered through a window function to avoid spectral leakage. A discussion can be found at en.wikipedia.org/wiki/Window_function.
For VoceVista the default Dolph-Chebyshev window works very well and gives a usable dynamic range of about 100 decibels. Do not change it unless you understand window functions and their respective trade-offs.
Pitch Detection
The Pitch Detection section configures the pitch algorithm. It runs in parallel with the FFT and produces the fundamental-pitch curve shown above the spectrogram.
Pitch Detection Time Window
The length of the audio segment fed to the pitch algorithm. The combo box shows both the number of samples and the resulting minimum detectable frequency (a 1024-sample window at 44100 Hz reaches down to about 43.1 Hz).
Longer time windows extend the algorithm’s reach to lower frequencies but reduce how quickly it can track changes. The default is appropriate for most situations.
Frequency Range to Detect
Minimum Clarity
The minimum confidence the algorithm must reach to accept a pitch result as valid, expressed as a percentage. Higher values reject ambiguous detections; lower values accept more — at the cost of more false positives.
Minimum Intensity
The minimum signal level (in dB) required for a pitch reading to count. Signals quieter than this threshold are ignored, even when their clarity passes the test above. This keeps background noise from producing spurious pitch tracks during silent passages.
Prefer Harmonic Fundamental
When checked, the pitch detector tries to find the fundamental frequency of harmonic sounds rather than reporting whichever harmonic is loudest. This is the right choice for analyzing musical instruments and the singing voice, where the fundamental is often weaker than its upper harmonics.
Profile
A Profile bundles every setting on this page into a named configuration that you can switch between in one click.
Default Profiles
VoceVista ships with four built-in profiles, tuned for different kinds of material:
- Singing — Narrowband
-
The default. Narrowband spectrogram (8192-point FFT) optimised to show the harmonics of the singing voice. Pitch detection runs at 50 Hz across a 65 Hz – 1400 Hz range with prefer-harmonic-fundamental enabled.
- Voice — Broadband
-
Same frequency settings as Narrowband, but with a much higher spectrogram update rate (300 / s). The shorter analysis window emphasises individual glottal cycles and formant transitions, at the cost of frequency resolution.
- Speech
-
Same window as Narrowband, but with stricter pitch detection: the clarity threshold is raised to 85% and the frequency range narrowed to 65 Hz – 400 Hz, so vowel pitch is detected reliably and unvoiced segments are rejected.
- Gongs / Singing Bowls
-
Ultra-narrowband: the FFT size is forced to its maximum (131072 points) for the highest possible frequency accuracy on long, inharmonic decays. Prefer-harmonic-fundamental is turned off so the pitch tracker follows the strongest partial rather than guessing at a missing fundamental.
Manage Profile
The Manage Profile button next to the profile dropdown opens a menu with the available actions:
- Reload
-
Discard changes you have made on this page and reload the saved values of the currently selected profile.
- Save
-
Save the current values back into the selected profile.
- Rename / Copy
-
Rename the current profile, or save it under a new name to create a user-defined copy.
- Delete
-
Remove the currently selected user-defined profile. Built-in profiles cannot be deleted.
Switching profiles applies all of that profile’s settings at once, so profiles are the fastest way to retune the analyzer for a different kind of material.