
Spectral Peaks Settings
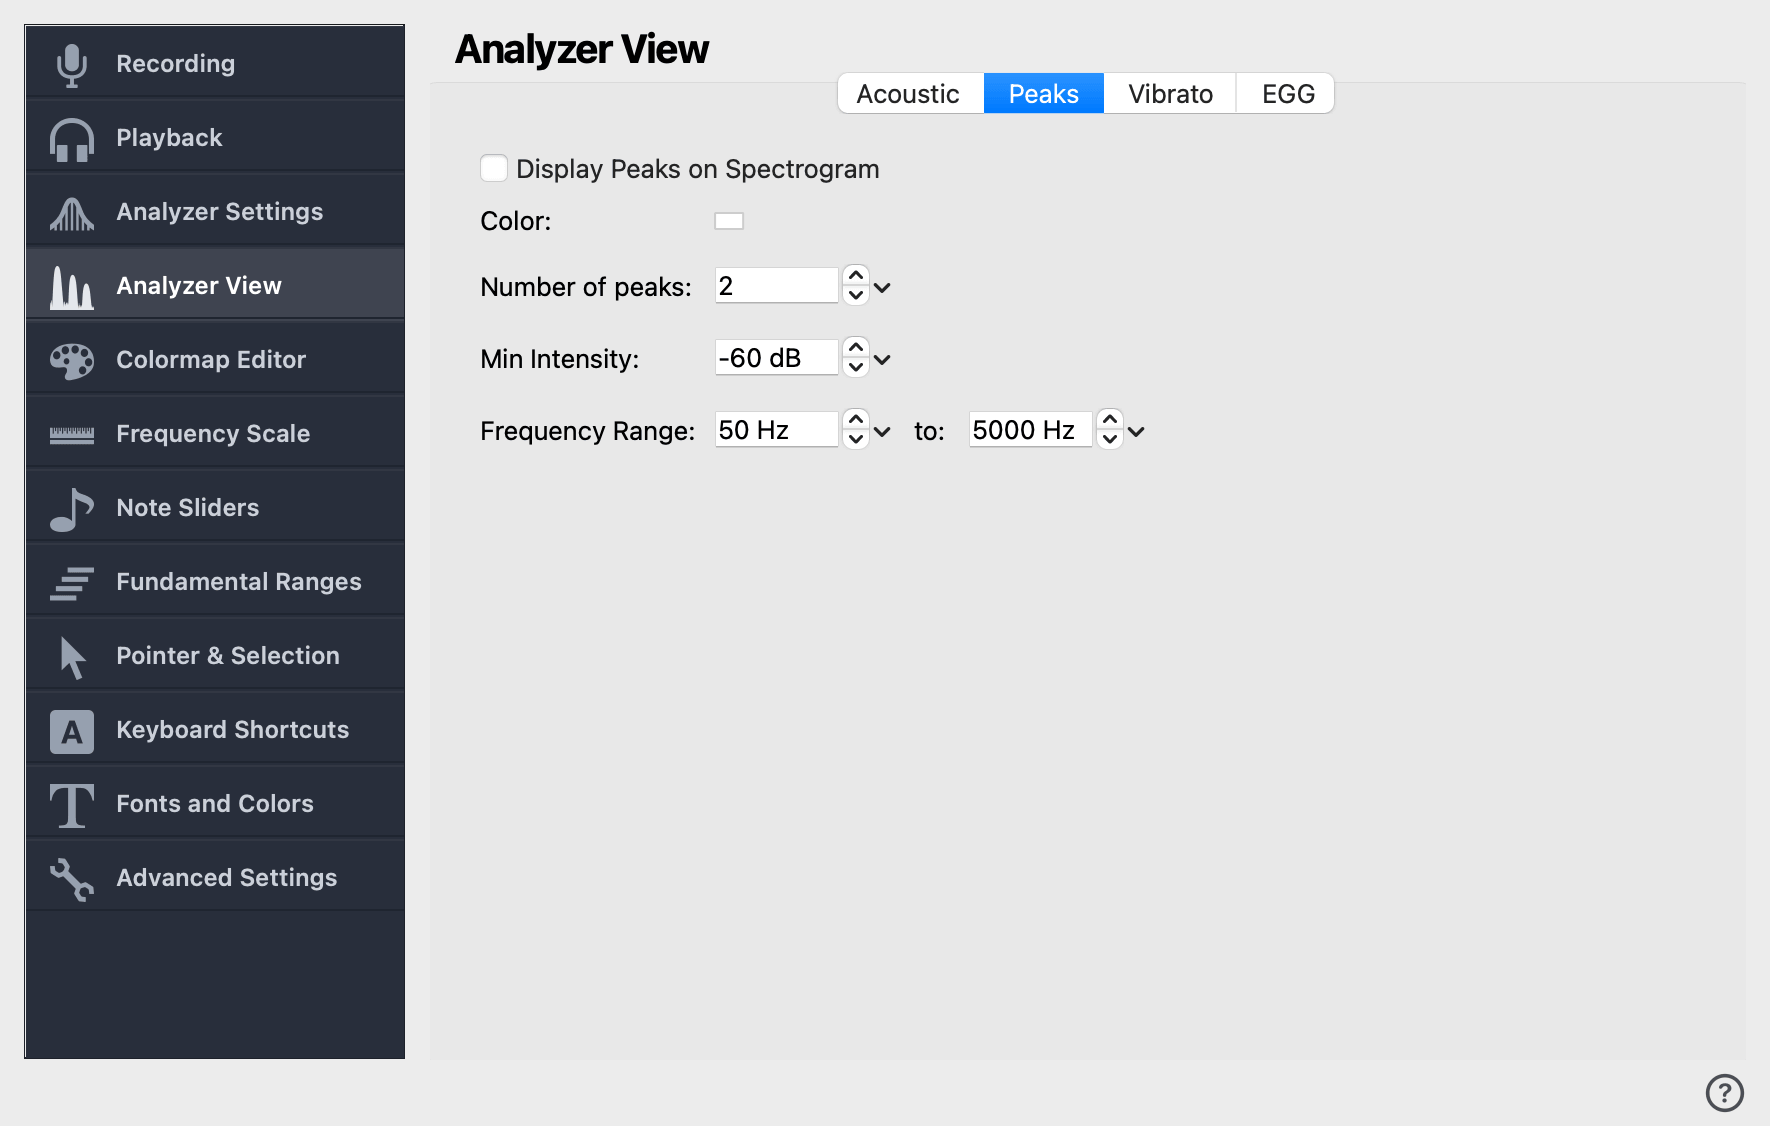
Figure 1. Spectral Peaks Settings
This page configures the detection and display of spectral peaks on the spectrogram. A spectral peak is a local maximum in the spectrum — a frequency that stands out above its neighbours — and is typically a harmonic, a formant, or a resonance.
Display Peaks on Spectrogram
When checked, the strongest spectral peaks at each time position are drawn on top of the spectrogram. Uncheck to compute peaks without drawing them on the spectrogram (the Statistics Pane still lists them).
Number of peaks
How many peaks to detect per analysis frame, from 0 to 12. Higher values reveal more spectral structure but clutter the display. The default is 2.