
Acoustic Analyzer View
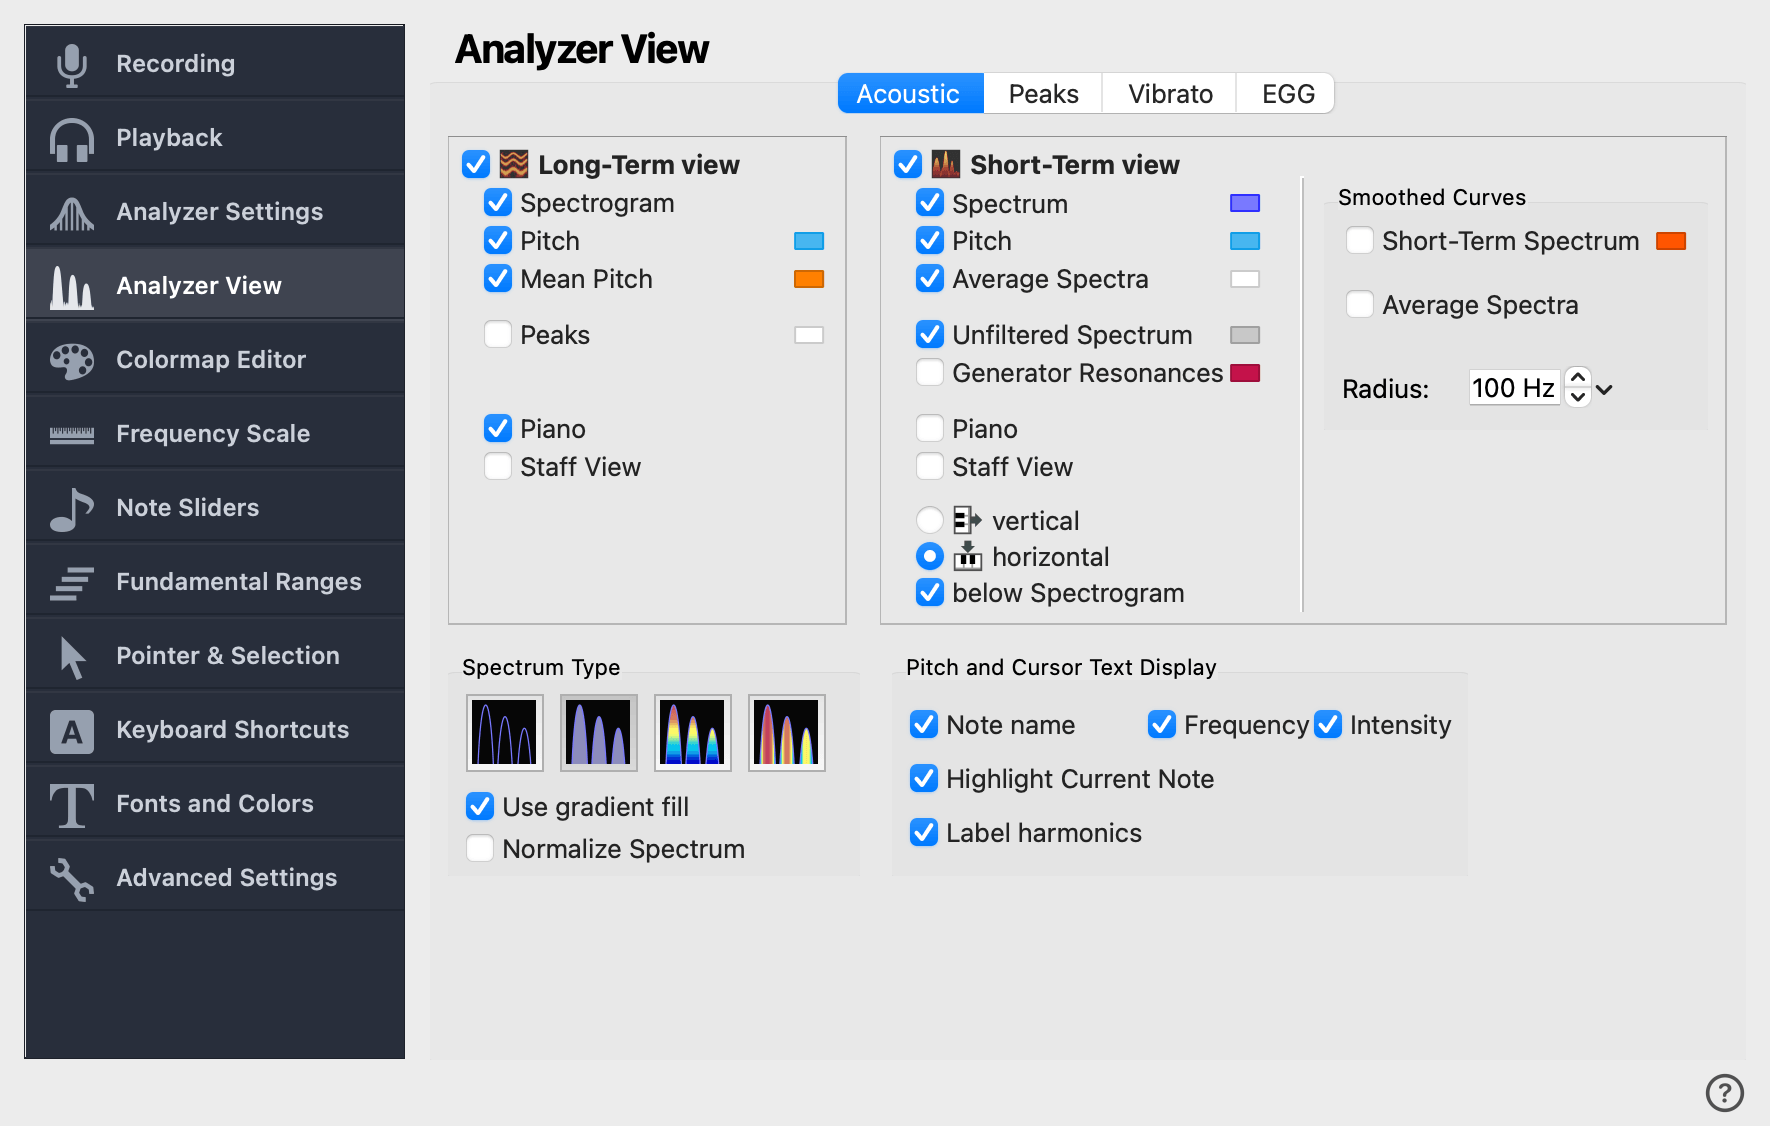
This settings page controls the appearance and behaviour of the Analyzer View: which displays are visible, how they are laid out, and what additional information is overlaid on them. Settings here do not affect what the analyzer measures (that is on the Analyzer Settings page) — only how the results are shown.
Long-Term view
Toggles the Long-Term view, which scrolls past as audio plays and can contain the spectrogram, the fundamental pitch, and several overlays. The checkboxes inside this group decide which of those layers are drawn.
- Spectrogram
-
Show how frequency intensities change over time. Colors are mapped from intensity using the current colormap (see Colormap Editor).
- Pitch
-
Mark the fundamental pitch on top of the spectrogram as a thin line.
- Mean Pitch
-
Overlay the mean pitch line used by the vibrato analysis.
- Peaks
-
Mark spectral peaks detected on the spectrogram.
- Generator Resonances
-
Show the resonances of the active filter generator on the spectrogram.
- Piano
-
Show a piano keyboard alongside the spectrogram’s frequency axis. The current note is highlighted while audio plays.
- Staff View
-
Show a musical staff alongside the spectrogram, with the current note rendered as a notehead.
Frequency Axis Orientation
- vertical
-
Spectrogram has a vertical frequency axis and a horizontal time axis — the most common arrangement.
- horizontal
-
Spectrogram has a horizontal frequency axis and a vertical time axis, i.e. time runs from top to bottom of the screen.
| The spectrogram orientation radio buttons are hidden by default, since most users keep the spectrogram in its standard vertical-frequency arrangement. Turn them on with Show Spectrogram Orientation Buttons on the Advanced Settings page. |
Short-Term view
Toggles the Short-Term view, which shows the spectrum at the current cursor position. When both the Long-Term and Short-Term views are active, moving the cursor on the Long-Term view updates the Short-Term view.
- Spectrum
-
Show the intensity of each frequency at the current time position.
- Pitch
-
Mark the current fundamental pitch on top of the spectrum.
- Average Spectra
-
Display the Long-term Average Spectrum (LTAS) of the current selection, and of any markers checked for comparison.
- Unfiltered Spectrum
-
When a frequency filter is active, also draw the unfiltered spectrum for reference.
- Generator Resonances
-
Show the resonances of the active filter generator on the spectrum.
- Piano
-
Show a piano keyboard alongside the spectrum’s frequency axis.
- Staff View
-
Show a musical staff alongside the spectrum.
Frequency Axis Orientation
- vertical
-
Spectrum has a vertical frequency axis and a horizontal intensity axis.
- horizontal
-
Spectrum has a horizontal frequency axis and a vertical intensity axis — the more familiar "amplitude over frequency" plot.
below Spectrogram
When the spectrogram has a vertical frequency axis and the spectrum a horizontal frequency axis, this option places the spectrum stacked under the spectrogram instead of beside it. Useful when the time axis is the most important dimension and you want to use the screen’s full width for it.
Smoothed Curves
A smoothed curve is a low-pass filtered version of a spectrum that emphasizes the spectral envelope rather than individual peaks. This group enables smoothing on the short-term spectrum and on average spectra, and configures how the smoothing radius is interpreted.
- Short-term Spectrum
-
Display a smoothed version of the short-term spectrum.
- Average Spectra
-
Display smoothed versions of the current LTAS and of marker average spectra checked for comparison.
Radius
The radius over which the source curve is averaged to produce the smoothed curve. The radio buttons next to the radius value set how the number is interpreted:
- Relative (% of Pitch)
-
The radius is expressed as a percentage of the current fundamental frequency. The smoothing scales with pitch, which is the right choice for following formant shapes across a sung phrase.
- Absolute (Hz)
-
The radius is a fixed number of Hertz, regardless of pitch. Useful when you want consistent smoothing in a frequency-band-of-interest rather than a pitch-relative one.
Spectrum Type
Four icon buttons choose the visual style of the spectrum:
-
Outline only — single line tracing the spectrum.
-
Outline and Monochrome Fill — outline with a single-color fill below.
-
Stacked Fill — outline with a colored fill matching the colormap.
-
Peak Fill — solid fill emphasizing the peaks.
Pitch and Cursor Text Display
These overlays put the current pitch and cursor information directly on the secondary (short-term) spectrum, so you can read the values without moving your eye away from the analysis.
- Note name
-
Print the note name of the pitch under the current cursor position on the secondary spectrum.
- Frequency
-
Display the frequency of the current pitch on the secondary spectrum.
- Intensity
-
Display the intensity of the current pitch on the secondary spectrum.
- Show current note on piano and staff view
-
Highlight the note at the cursor position as a pressed key on the piano view, and as a notehead on the staff view.
- Label harmonics
-
Label each detected harmonic with its number (H1, H2, …) on the spectrum.