
Advanced Settings
The Advanced Settings page collects fine-grained controls intended for power users. Settings are organized into a tree of categories you can expand or collapse on the left of the dialog. Some settings — language, audio backend choice — only take effect after restarting the program.
| A few categories are conditional. The Statistics Panel category appears only in VoceVista Pro. The Audio Backend row appears only on macOS, and the Enable DirectSound input, Enable Loopback recording, Enable ASIO driver, and Graphics Performance entries appear only on Windows. |
System
Reopen last session at startup
When checked, VoceVista remembers the files that were open at shutdown and reopens them on the next launch.
Number of uncompressed files to cache
When loading a compressed file (Mp3, Ogg, …), VoceVista first decompresses it into a temporary uncompressed file for fast scrolling and editing. This setting limits how many decompressed files are kept in the temp folder. Reopening a file that is still cached skips decompression entirely, which is much faster.
Cache Folder
A drop-down with two commands. The label also shows the current size of the cache folder in parentheses (or empty if nothing is cached).
- Clear Cache Folder
-
Empty the decompressed-file cache. Useful if disk space is tight.
- Show in Explorer / Show in Finder
-
Open the cache folder in the OS file manager.
Encoders
MP3 Compression Quality
The MP3 LAME-encoder preset used when exporting MP3 files:
- Insane (320 kbps)
-
Highest quality, largest files.
- Extreme (200–240 kbps)
-
Near-transparent quality.
- Standard (170–210 kbps)
-
Default. Good quality / size balance.
- Medium (150–180 kbps)
-
Smaller files, audible compression artefacts on demanding material.
Display
Waveform
Scales
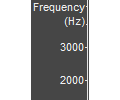
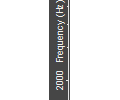
Use vertical scale labels
When checked, scale labels along the Y axis are drawn vertically. Vertical labels save horizontal space; horizontal labels are easier to read. The setting is also accessible by right-clicking the actual scale.
|
|
Y-Scale with horizontal text |
Scale with vertical text |
Show only scale units
By default the scales include the name and unit (e.g. "Time (s)", "Frequency (Hz)"). When checked, only the unit is shown ("s", "Hz").
Markers
These visibility toggles refine which markers are drawn where, on top of the per-marker-type visibility set in the Markers menu.
Fixed Timeline Range (in minutes)
By default, the timeline range starts at 10 seconds and grows as the recording grows. Setting a value here pins the timeline to that length at all times.
Initial number of note sliders
The number of Note Sliders used for new empty documents and for existing documents loaded for the first time.
Spectrogram Scroll Mode
What the spectrogram does when the time cursor reaches the end of the visible range during recording or playback.
- Scrolling
-
Keep the time cursor at a fixed position and slide the spectrogram to the left.
- Paging
-
Switch to a fresh empty page and let the time cursor advance across it.
Show Spectrogram Orientation Buttons
Show the small icons that switch the spectrogram between vertical and horizontal frequency axes (the same toggle is on the Acoustic Analyzer View page).
Decibel distance for background lines on spectrum
Draws horizontal background lines on the spectrum at this dB interval. The default of 10 dB is a useful coarse grid.
Decibel range of normalized spectrum
The dynamic range shown on the spectrum when Normalize Spectrum is enabled (see Acoustic Analyzer View).
Toolbars are floatable
When checked, toolbars can be undocked and floated as separate windows. When unchecked, they are pinned to their docking positions.
Statistics Panel
|
Available in VoceVista Pro
These settings only have an effect in VoceVista Pro, which is the edition that ships the Statistics Pane. |
Recording
Insert silence after each take (in seconds)
The number of seconds of silence appended to the file each time recording is stopped. Useful for keeping takes visually separated on the timeline.
Automatically start recording when program starts
When checked, the program starts recording into a new empty file at
launch. The same effect can be triggered by passing /record on
the command line.
Signal Generator
The Signal Generator plays a test signal over a sound output, used mainly to measure the resonance of the oral cavity by playing a known signal into it and analyzing the echo.
Wave Output Device
The output device used for the test signal. Pick a separate device from your main playback device when you want the test signal in one place (e.g. a small speaker pointed at the singer) and the recording playback elsewhere.
Cursor Lines
Show Playback Cursor Line
Show the green vertical line that indicates the current playback position. Turning it off is mostly useful when taking screenshots.
| The visibility of the time, frequency, intensity, and time-range cursor lines moved to the Selection and Pointer page in a recent release. Set them there. |
Vowel Chart
These settings control the appearance and behaviour of the Vowel Chart.
Show Vowel Chart Toolbar
Show the small toolbar at the top of the Vowel Chart with quick toggles for the most common chart options.
Show note names for f1/f2
Annotate the chart axes with note names for the first two vocal-tract resonances (fR1 and fR2).
Lock aspect ratio
When checked, the fR1 / fR2 axes are forced to the same scale, which keeps vowel-chart shapes recognizable when the window is resized.
Play Vowels
When checked, hovering over a vowel position in the chart synthesizes the corresponding sound through the Wave Output Device.
Audio Performance
Audio Backend (macOS only)
Choose which low-level audio API VoceVista uses for capture and playback. The default is the cross-platform PortAudio backend; RtAudio and Qt Audio are available as fallback options when a device misbehaves under PortAudio. Changing the backend takes effect after restarting the program.
Enable DirectSound input (Windows only)
When checked, the DirectSound API is available for input. DirectSound performs automatic sample-rate conversion in software, which is convenient when the device’s hardware rate doesn’t match the recording rate.
Enable Loopback recording (Windows only)
When checked (and WASAPI support is available), you can record "what you hear" by selecting your output device as the input source. Disabling Loopback hides such devices from the input list.
Enable ASIO driver (Windows only)
When checked, the ASIO API is available for low-latency input and output. The same toggle exists on the Recording Settings page.
Recording Latency (ms)
The approximate time between a sound arriving at the microphone and its appearance on the screen. Lower values mean the analyzer feels more responsive; values that are too low can cause clicks or gaps in the recording when the computer cannot keep up.
File Playback Latency (ms)
Same as the recording latency, but for playback. Lower values reduce the lag between actions (changing playback position, toggling a filter) and the audible response. Values that are too low can cause audible clicks during playback.
Tone Generator
These settings affect only the Sine Wave Generator that plays overtones and piano keys.
Input Level Meter
The Input Level Meter is the slider on the toolbar that shows input volume and the current input signal strength.
Enable monitoring
When the Input Level Meter is enabled, VoceVista continuously records from the input device so the meter can move. Turn this off to suspend that recording.
The same toggle is on the right-click context menu of the level meter on the toolbar.