
Quickstart Tutorial
This guide will show you how to record and visualize your voice or instrument with VoceVista. If you have no idea what to do with VoceVista, this is the place to start. This tutorial is intended to be a short introduction that gives you an overview of the elements of the program. You can find more detailed explanations of everything in the Reference Guide.
|
Some features require VoceVista Video or higher
Some of the features shown in this guide (most notably the Frequency Filters) are only available in VoceVista Video and higher. To follow this tutorial, you can download a free 30-day trial version of VoceVista Pro at our download page. |
|
This guide is available in various formats:
|
Prerequisites
-
You have installed VoceVista on your computer.
Our software comes in multiple editions with different feature sets. You can actually follow this tutorial in all three editions. The only section that requires at least VoceVista Video is the section about Frequency Filters. Apart from that, some screenshots show sections of the recording labelled with Markers. This feature is only available in VoceVista Pro, so if you want follow the tutorial and see exactly the same screenshots, use that edition.
-
You have a working microphone connected to your computer, or you use a laptop with a built-in microphone.
If you have not completed the above two steps, see System Requirements for more information about what you need, and Installation for help with installing the software. This tutorial was made with VoceVista version 5.8.0. If you are using an older or newer version of the software, some things might look and work slightly differently.
Configuration
Apply Settings Profile
First let’s configure the program to a predefined state, so that you can follow this tutorial and see the same things as shown here. Click on the profile list on the toolbar (the box that says “Select Profile”) and select the Quickstart profile:
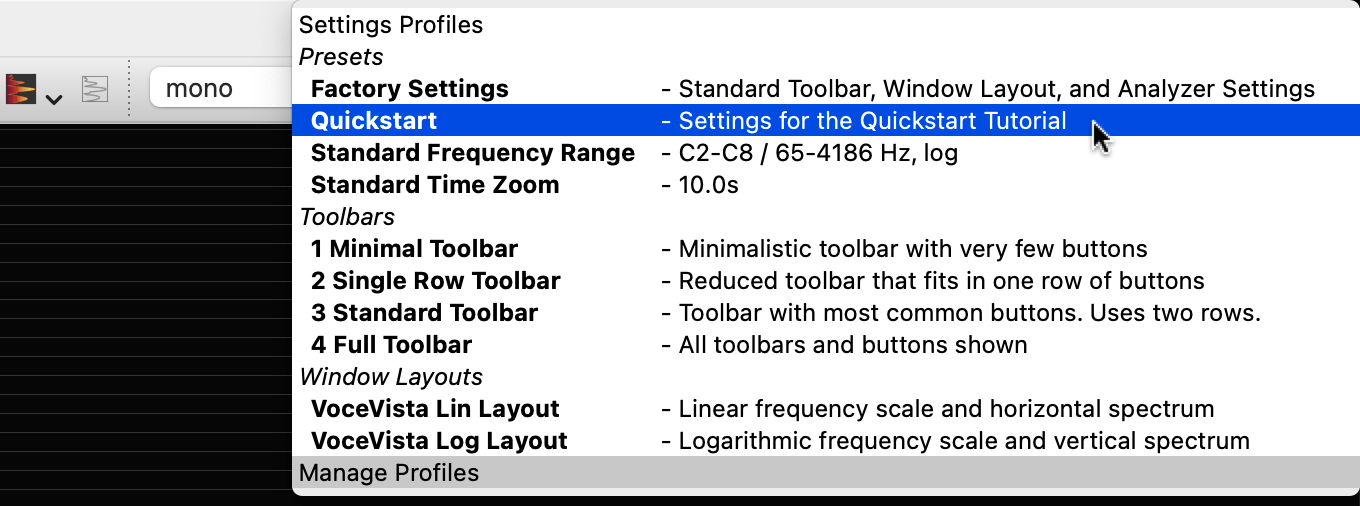
A profile is a set of saved settings. Selecting a profile is a shortcut for applying all the settings stored in that profile. There is no difference between applying a profile, and going through the program options and manually selecting the corresponding settings. Now the program should look like this:
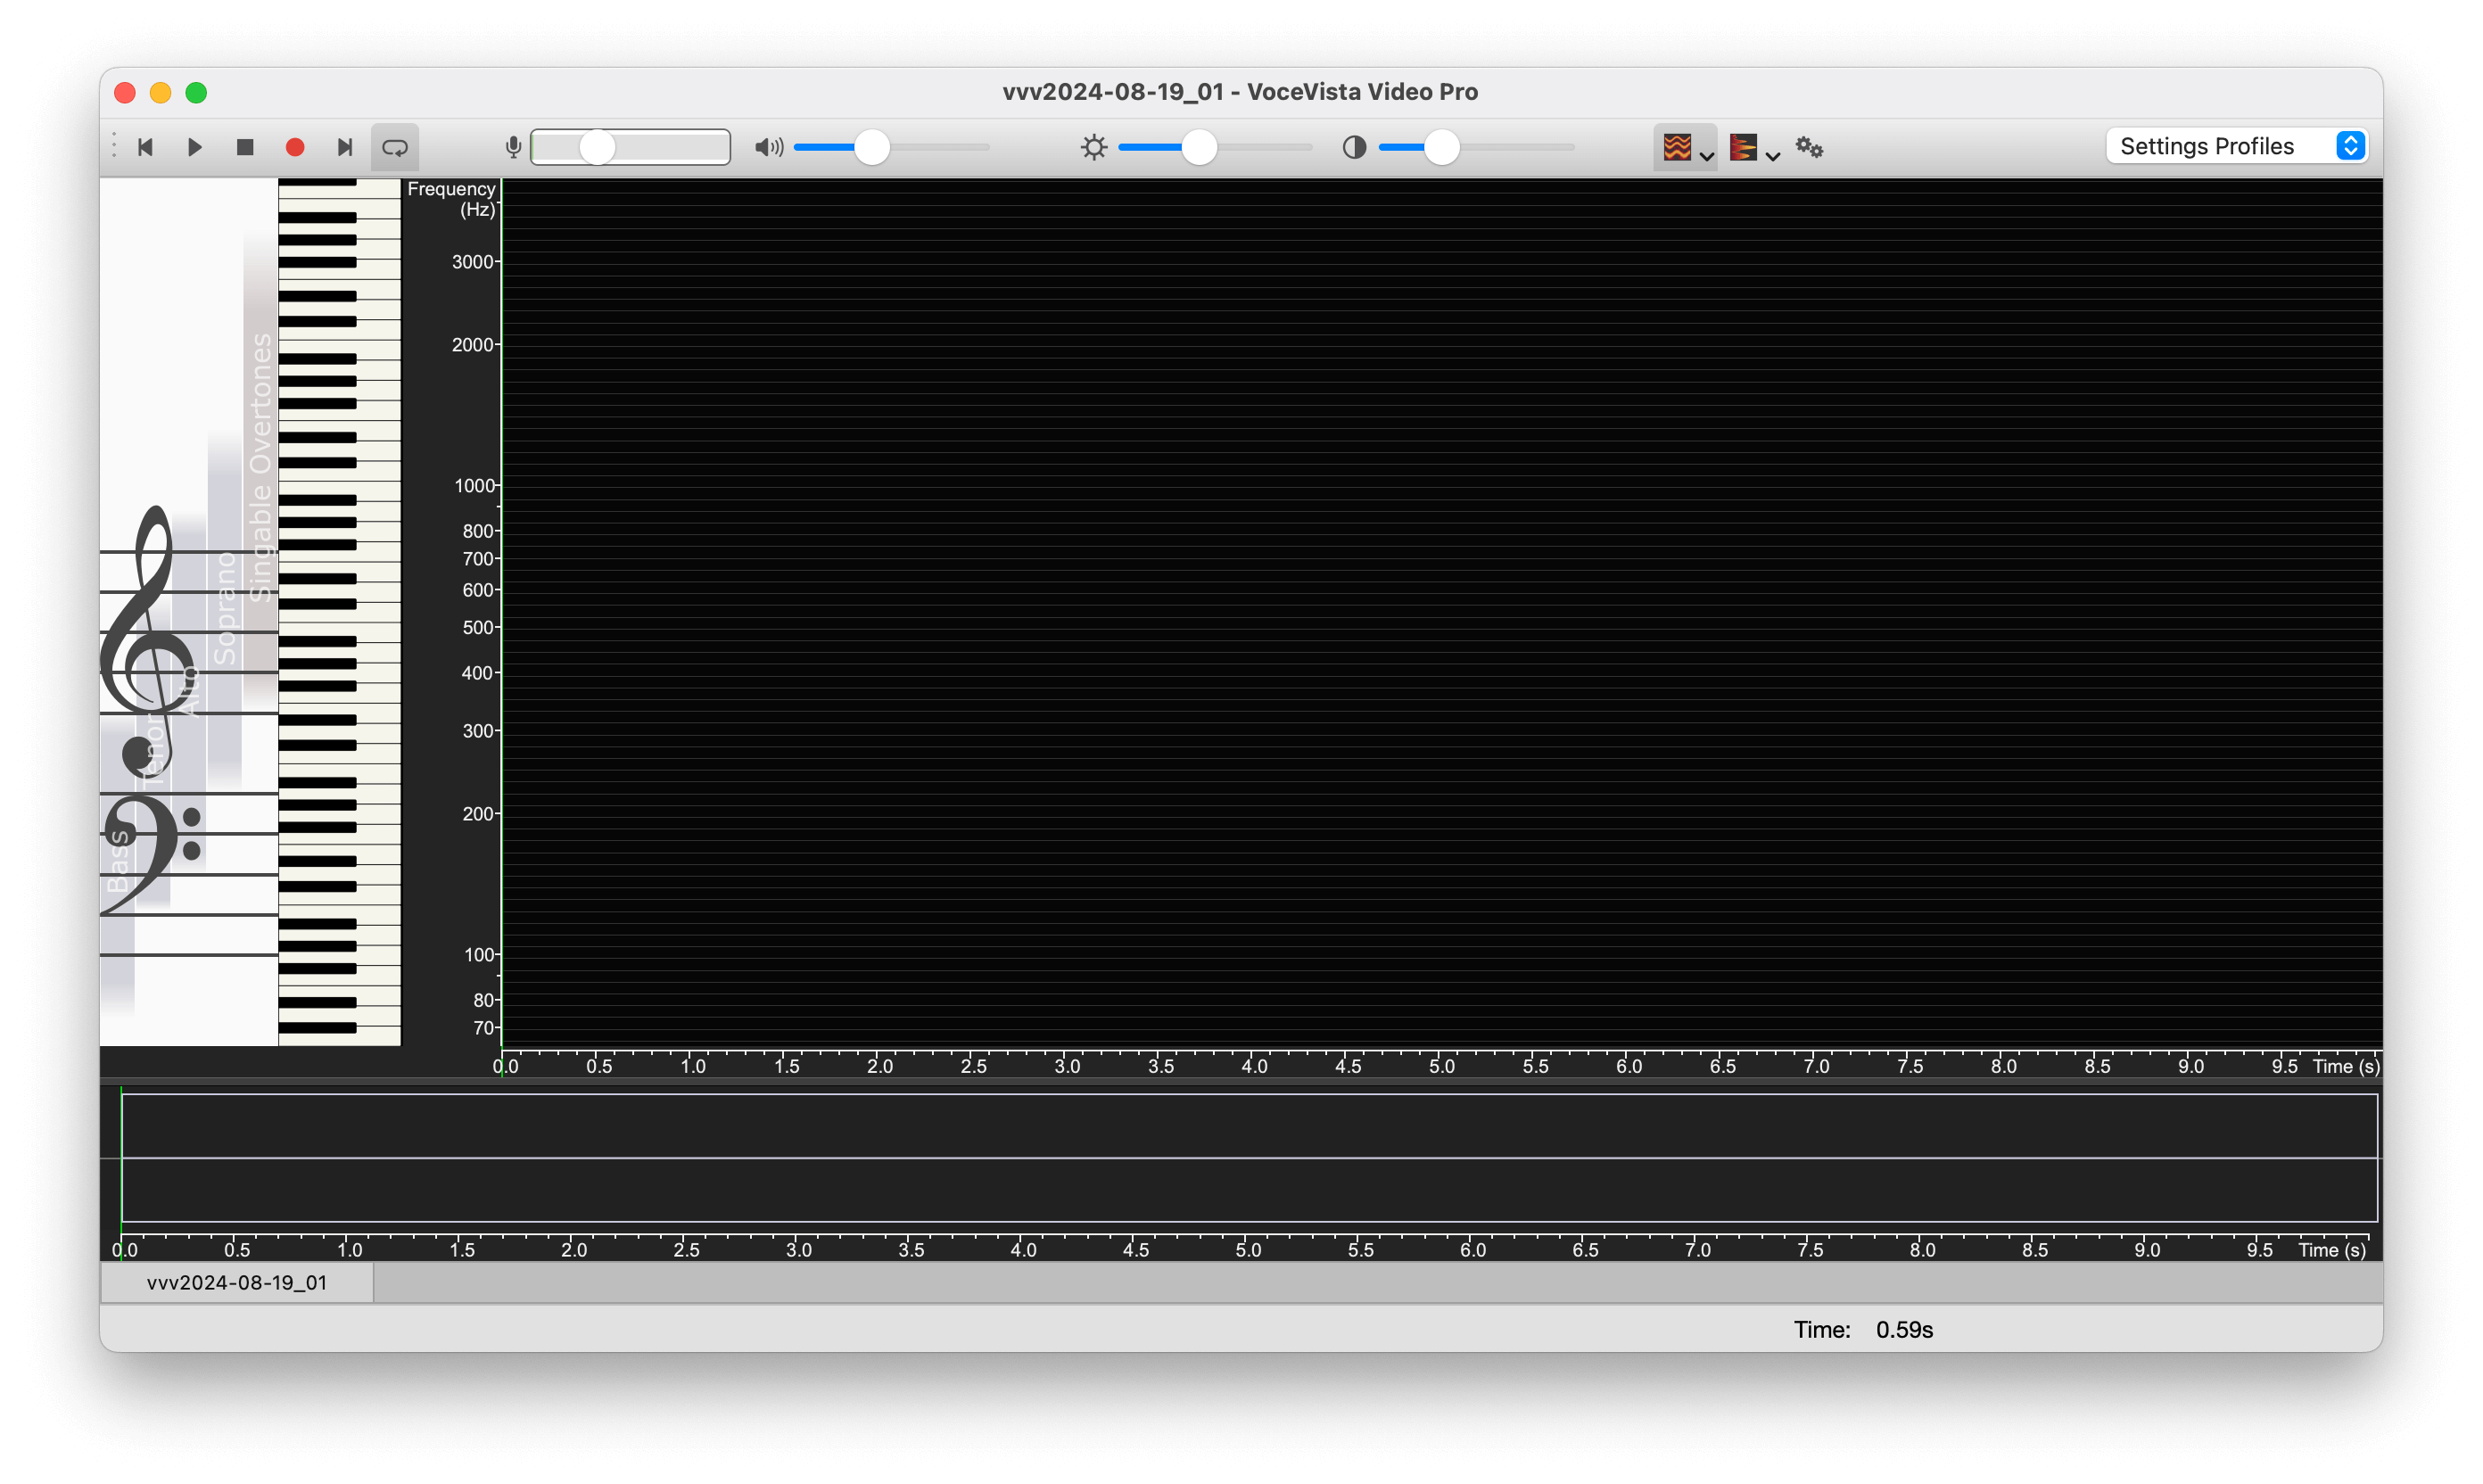
In this screenshot you can see the empty Timeline on the bottom, the Staff View and Piano on the left, the empty Analyzer View in the main section, and the Toolbar on the top.
Here is a closer look at the Toolbar. This is a simplified toolbar profile with only the most important elements. As you get more proficient with VoceVista, you can switch the toolbar by clicking on the profile selector and choosing another toolbar profile.

Recording
Select Recording Source
Now we will check that you are recording from the correct microphone. Point at the Input Volume control on the toolbar and wait until a tooltip appears. This will show the active input device from which audio will be recorded:

To see a list of all available audio input devices, open the
Recording Settings. To do so, click on
the Settings button on the toolbar
 , and
then select Recording on the left. Now you can click on the list of
input devices and select the one you want to record from:
, and
then select Recording on the left. Now you can click on the list of
input devices and select the one you want to record from:

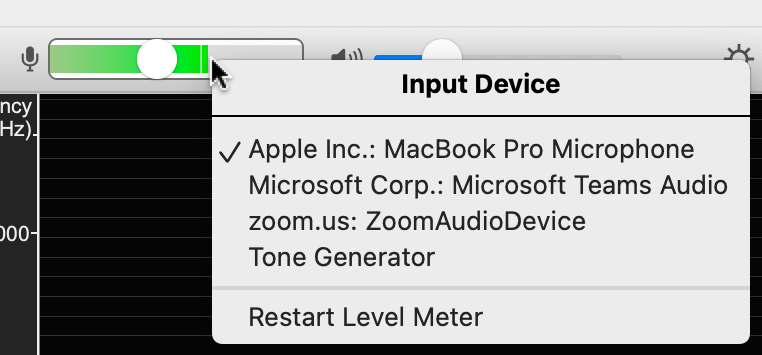
Another way to quickly select the active audio device for recording is to right-click on the Input Volume control on the toolbar and make sure the correct microphone is selected:
Start recording
Now you are ready to record some sound. Click the Record button on the
toolbar
 , or
press Ctrl+Space or R to start
recording.
, or
press Ctrl+Space or R to start
recording.
Grant microphone access
If you are running VoceVista on macOS for the first time, there may be a security prompt asking whether the program is allowed to access the microphone. Click on Allow to grant microphone access:
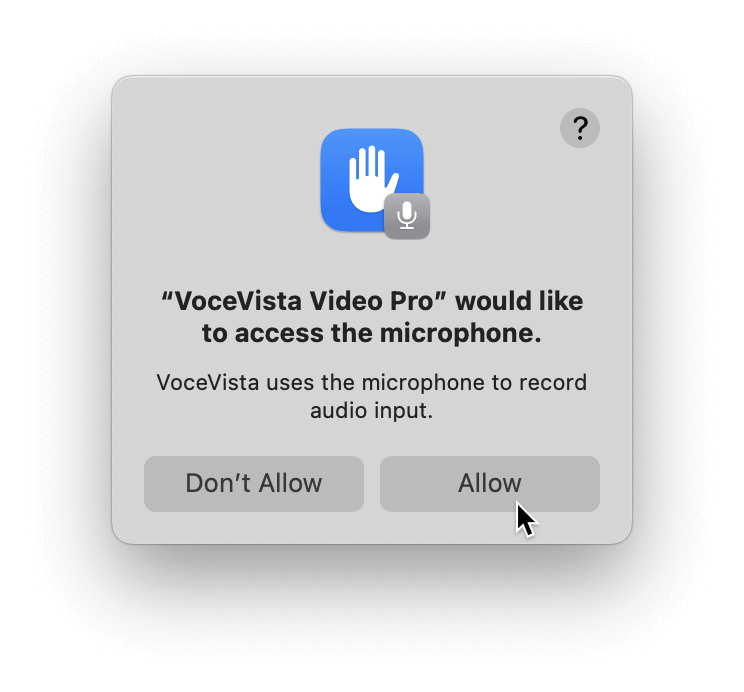
If microphone access hasn’t been granted, recording will not work. If that is the case, you can open the macOS System Settings to grant access later under "Privacy & Security". On Windows, there is a similar setting under "PC Settings / Privacy". For more details, check our guide for troubleshooting audio input.
Set Input Level
If recording has started successfully, the green time cursor line should start moving to the right. Make some noises and sounds into the microphone and watch how the Timeline at the bottom of the screen will fill up with content.
During the recording keep an eye on the Input Volume control and the Timeline and adjust the Input Volume Slider or the distance to the microphone if the recording is too quiet or too loud.
|
|
Recording Volume too low: Analyzer Display will lack detail, and recording is barely audible during playback. Move the input volume slider to the right, or move closer to your microphone. |
|
|
Recording Volume too high: Analyzer will show clipping artefacts (this is worse than the volume being too low!). Recording sounds screetchy and distorted during playback and is unusable. Move the input volume slider to the left, or increase your distance to the microphone. |
|
|
Recording Volume optimal:Signal uses most of the available dynamic range without clipping. Analyzer will show best amount of detail. Sounds good during playback. |
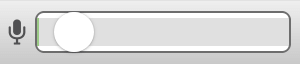
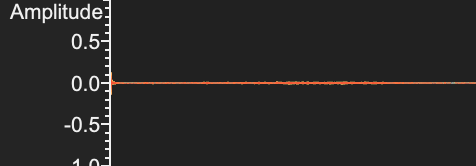
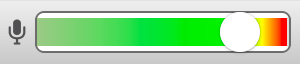
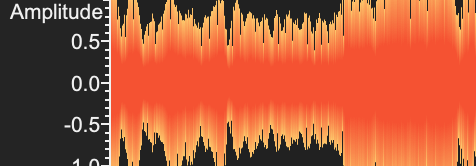
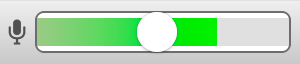
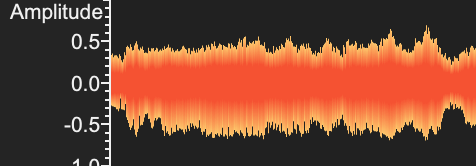
Make some sounds into your microphone and adjust the recording level until it is getting a strong signal without clipping. This means that the background of the input level meter should never reach the red zone, and the content in the Timeline and/or Waveform should never touch the upper and lower edges of the view.
If you are recording singing, be aware that the dynamic range of a trained singer can be extreme. This means that singing can get very loud, and the input volume might need to be lower than you think to prevent clipping and distortion of the recording when the singer is singing high notes at high volume. In those cases, besides lowering the input volume, it might help to increase the distance to the mic a bit, or to use a better microphone.
Sing a tone
Now let’s try some singing. For example, click on a key of the piano keyboard, listen to it, and then try to sing the same pitch. Fill up half a screen and then press Space or click the stop button on the toolbar to stop recording. This should look something like this:
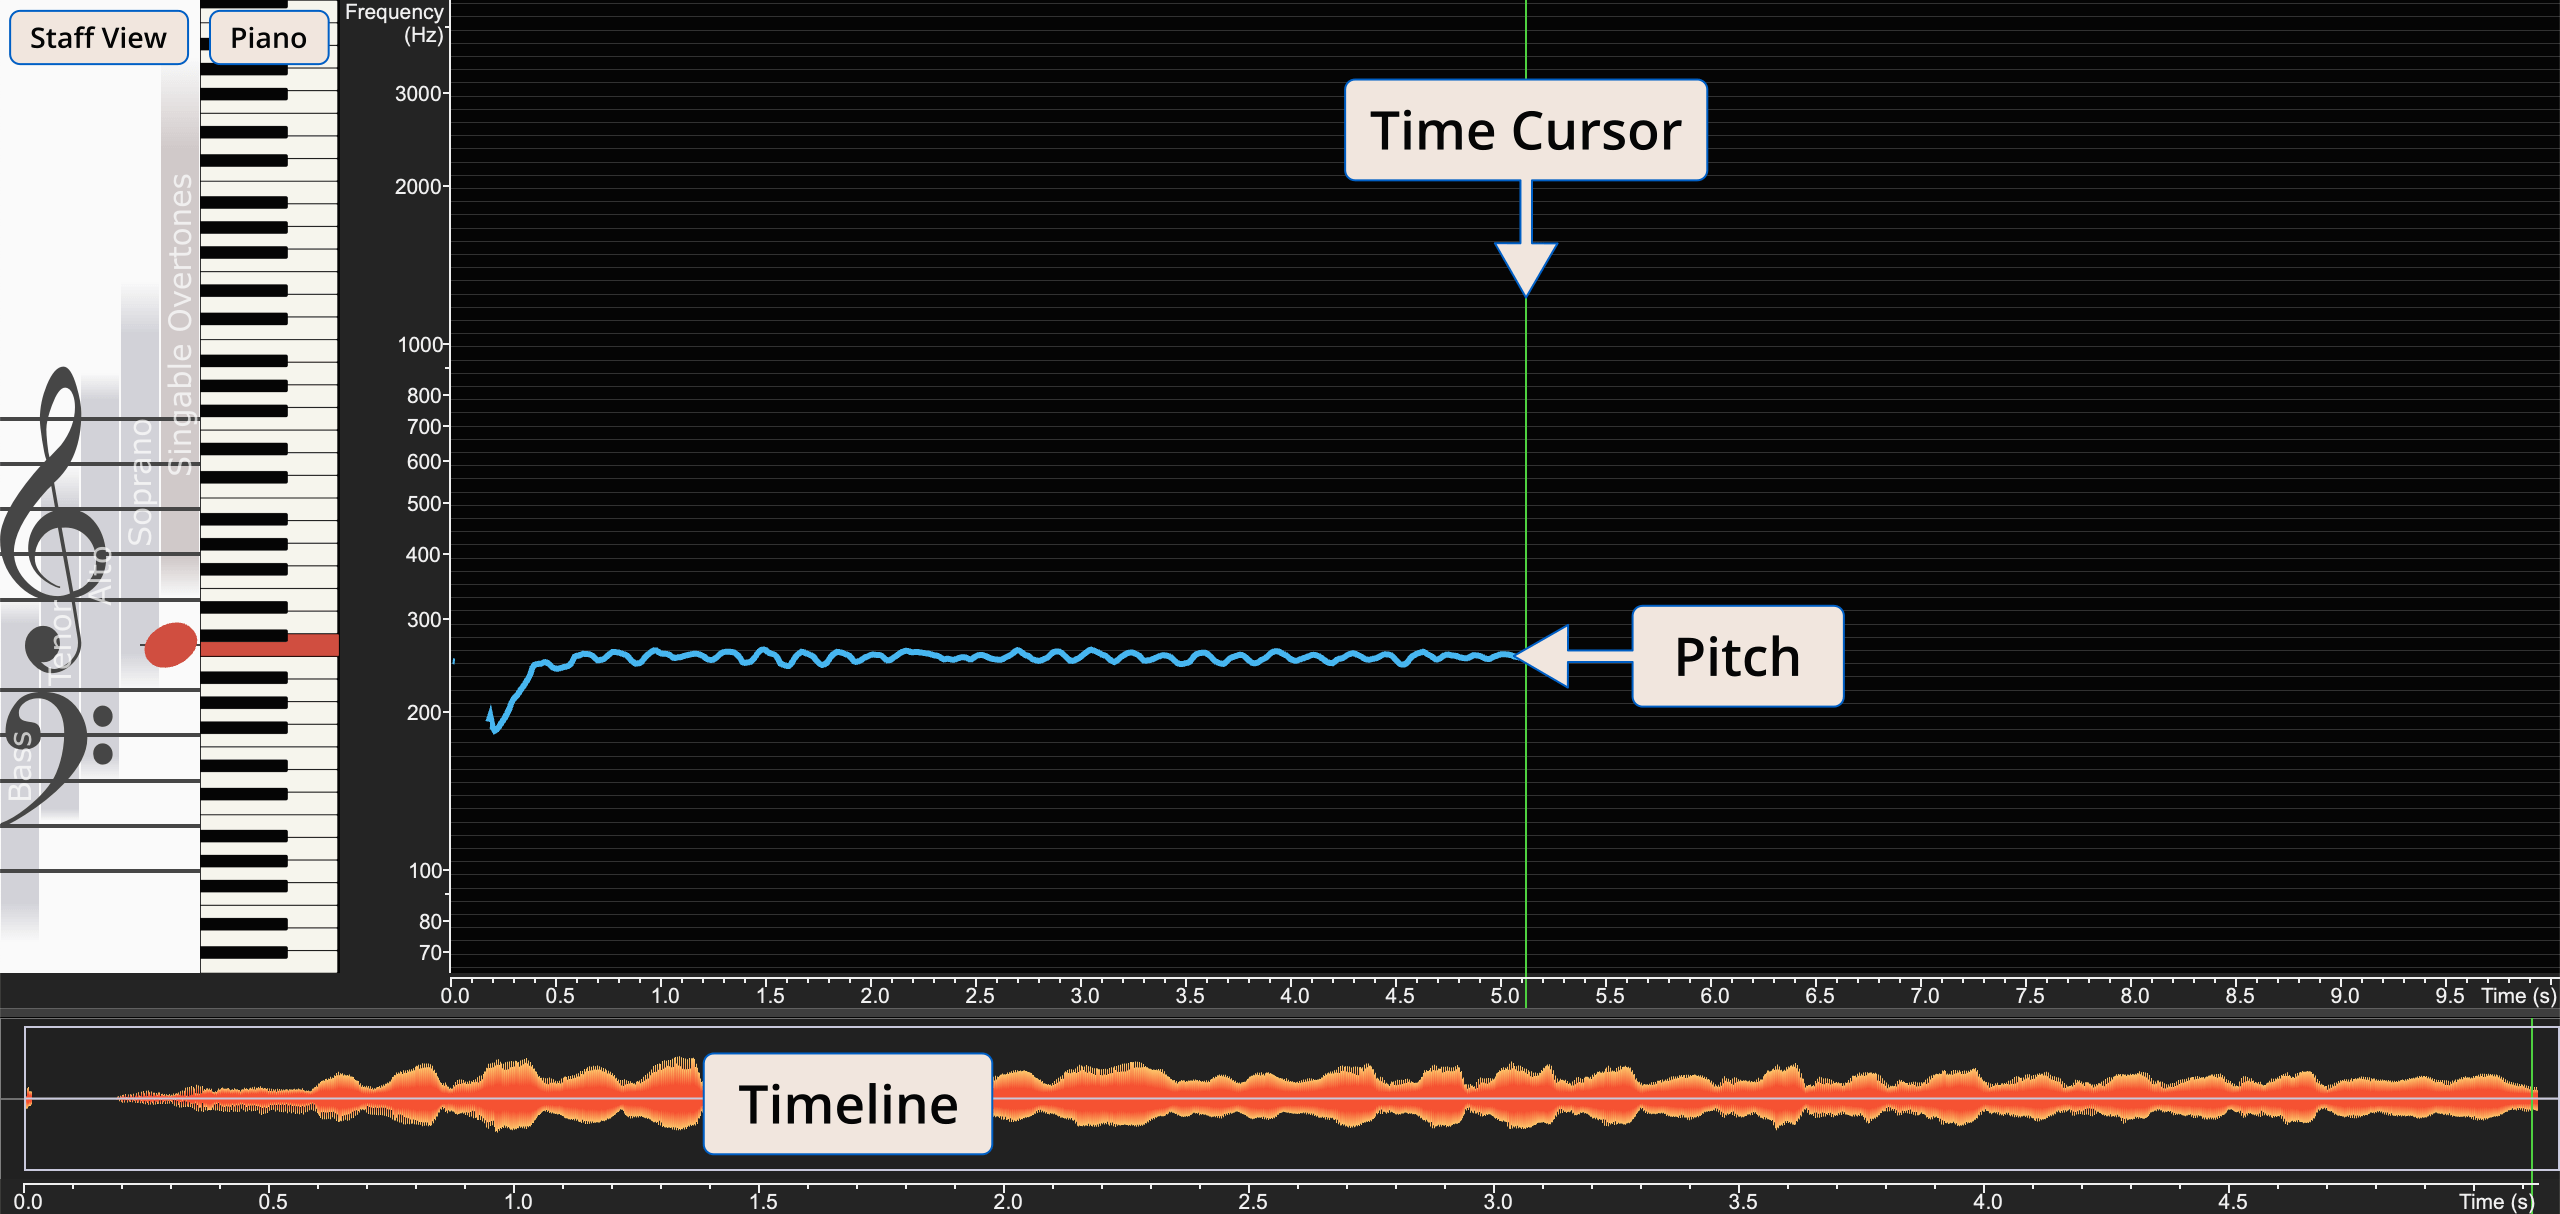
The Timeline at the bottom shows the intensity (or volume) of your sound as a waveform display. The horizontal blue line in the middle is the pitch of your voice. The vertical green line is the Time Cursor. The Piano highlights the key that best matches the pitch of the recording at the time where the Time Cursor is, and the Staff View shows the same key as a musical note.
-
Now try to play some other notes on the piano keyboard, and record your voice to see if you can sing the matching pitch.
-
Then try to sing or whistle some melodies, and observe how the blue pitch line and the notes on the piano and staff view respond to your sound.
Scrolling and Zooming
While recording some sound, you have seen how the horizontal axis shows the time of the recording, and the vertical axis shows the frequency of the pitch at any given time.
Once your recording gets longer than a few seconds, you might want to choose which part of the recording you currently see. This can be done with scrolling and zooming the visible time range. Also, depending on the content that you are currently working with, you might want to change the visible frequency range. In this section we will do both.
Loading sample file
Let’s load a sample file so that you can follow this tutorial and see exactly the same screens as shown here . Click on and select the file “A01_male_intervals.flac”.
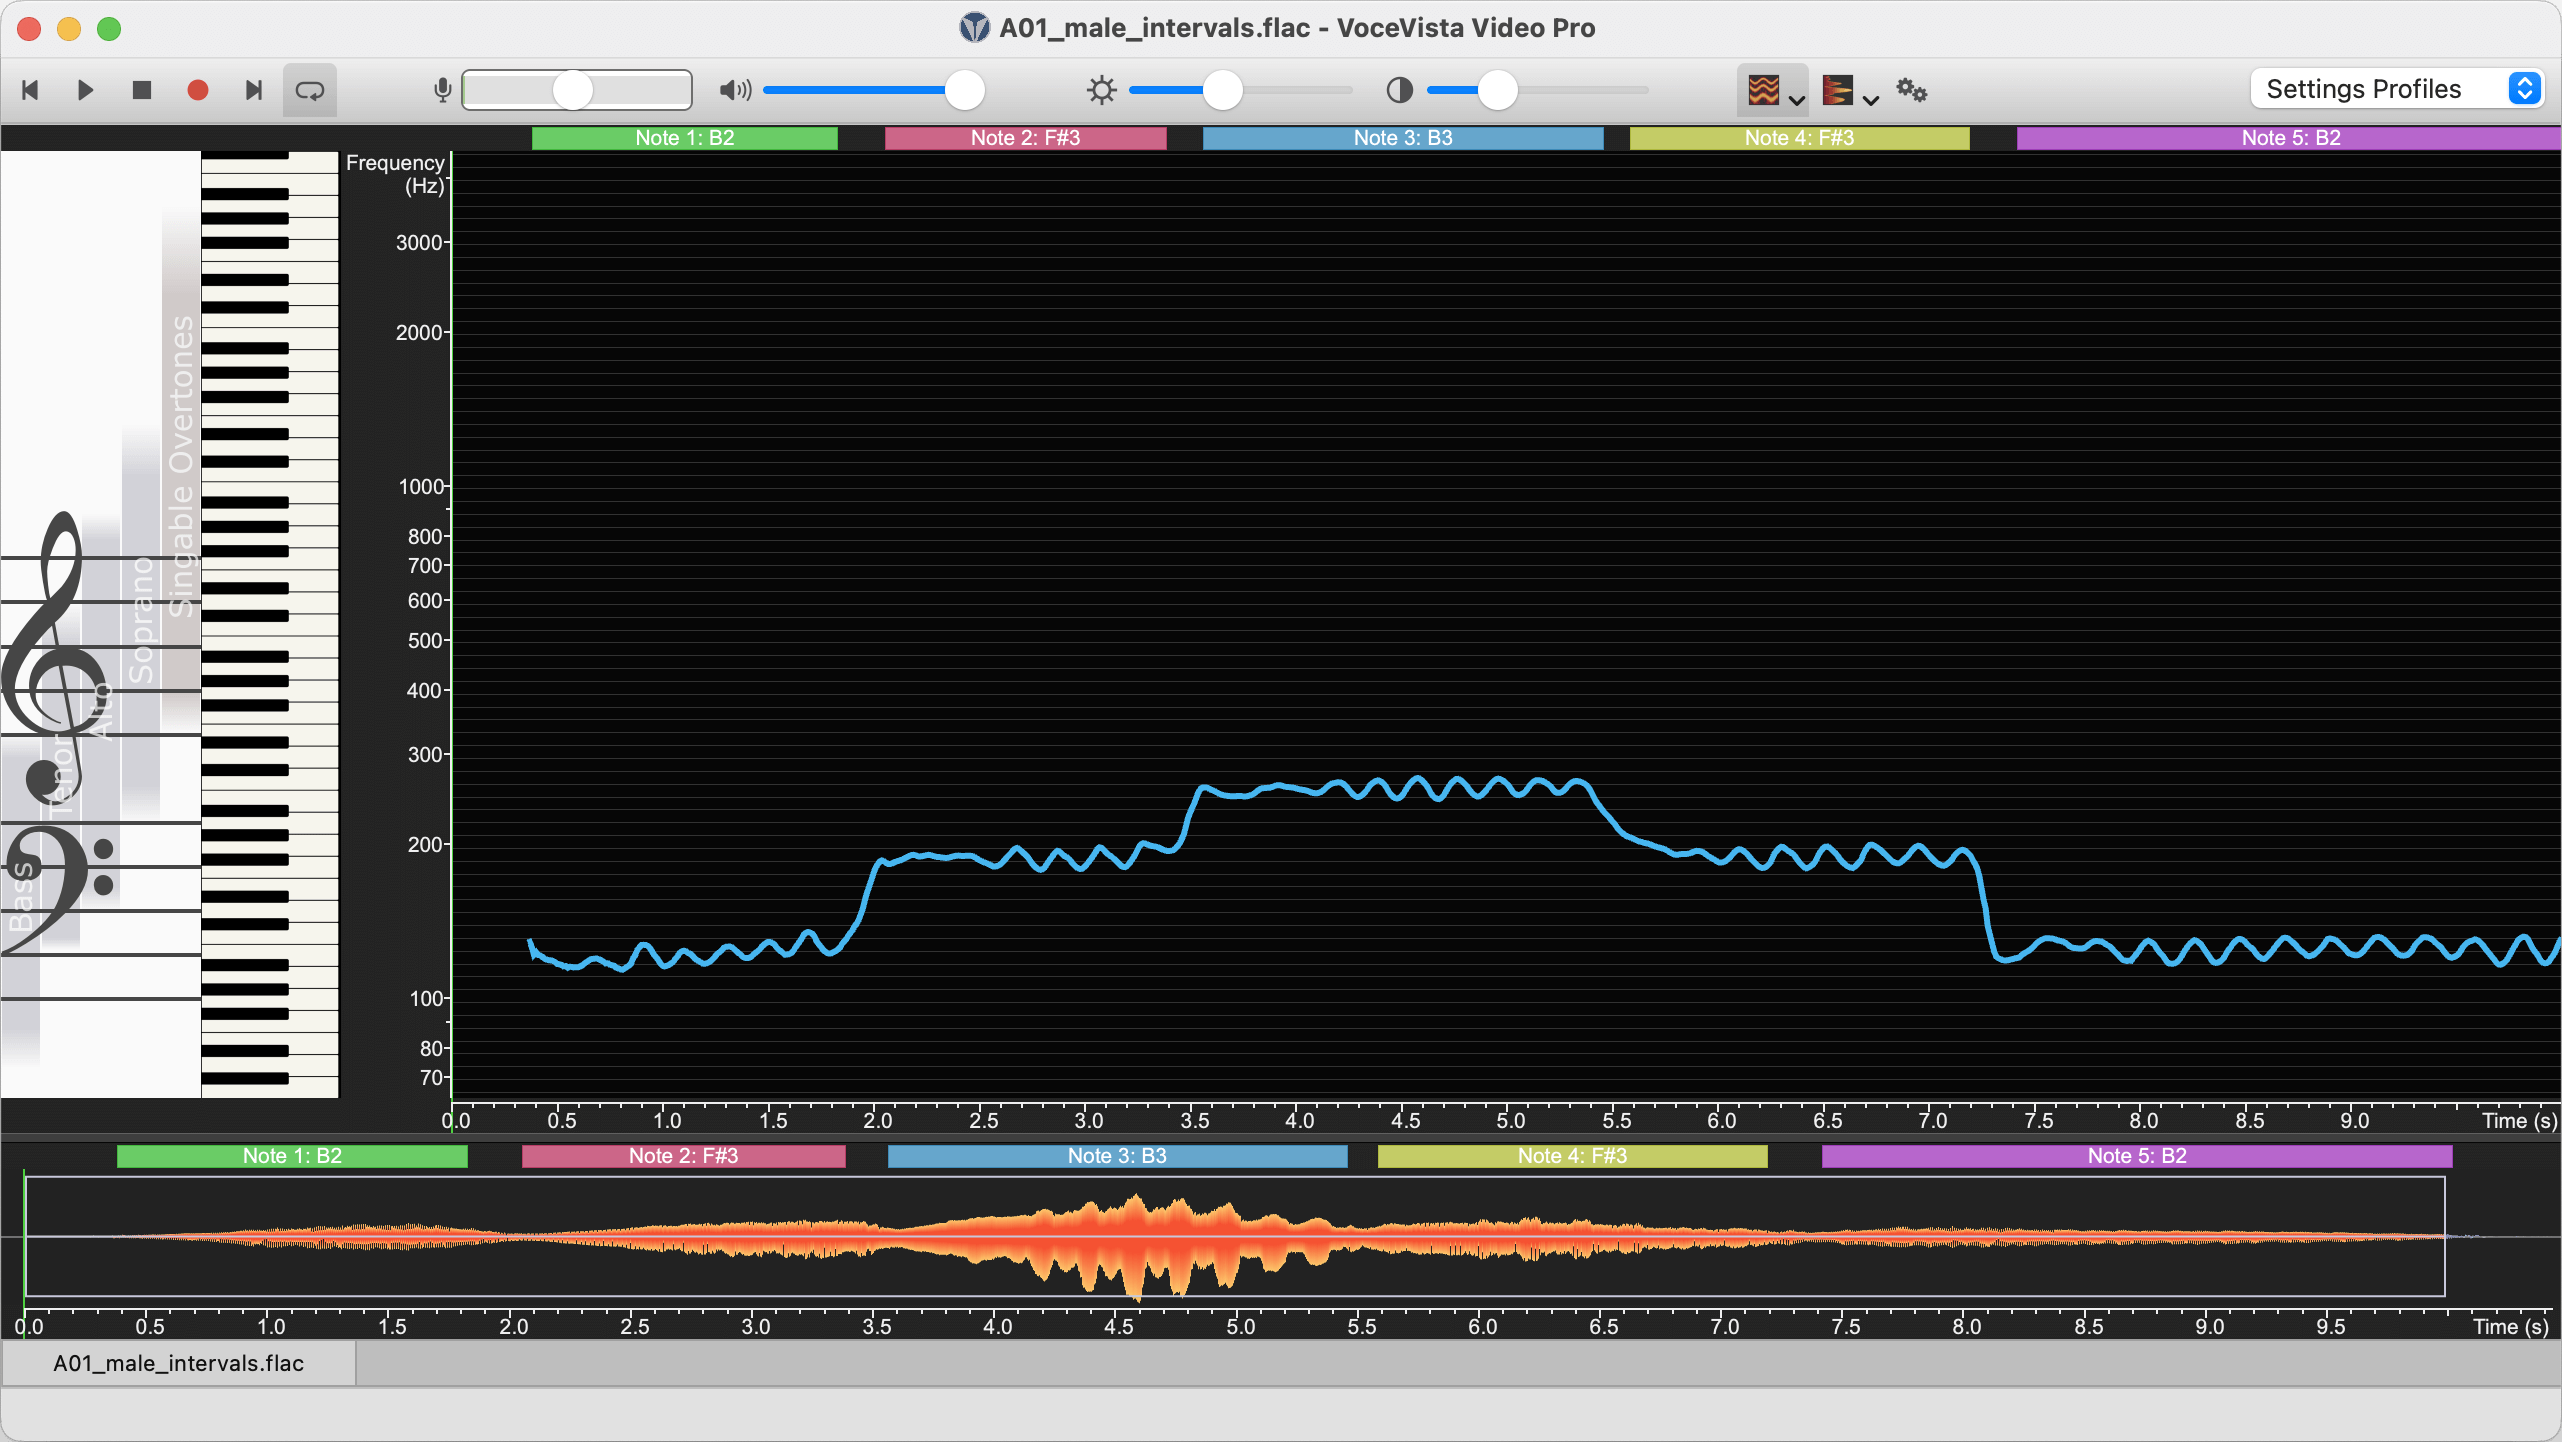
After you have opened the file, click on the profile list and select the “Quickstart” profile again to ensure your view matches the following screenshots. Remember that you can always restore the Quickstart or Factory Settings profiles if you want to return the program to the initial state. Your screen should now look like this:
First, let’s listen to the file. Click on the play button on the toolbar
 or press
Space to start playback. You can adjust the loudness on the output
volume slider on the toolbar. Listen to the recording and then press
Space again when you are done to stop playback.
or press
Space to start playback. You can adjust the loudness on the output
volume slider on the toolbar. Listen to the recording and then press
Space again when you are done to stop playback.
In this sample, the singer is singing a triad consisting of three different musical notes. Let’s zoom in to see precisely which notes those are, and how accurately the singer was singing them.
Zoom in time
Let’s examine the first sung note more closely.
Press and hold the button of your trackpad or mouse, and move the pointer over the blue pitch line. Notice how this moves the green time cursor line. The current time position is displayed on the status bar at the bottom of the window, along with details about the current pitch frequency and musical note at that point in time.
Move the green time cursor line to be exactly at the time point "1.0 seconds". Now click on the menu or press the 1 key to zoom in the current time range. Do this one more time. Now you should see something like this:
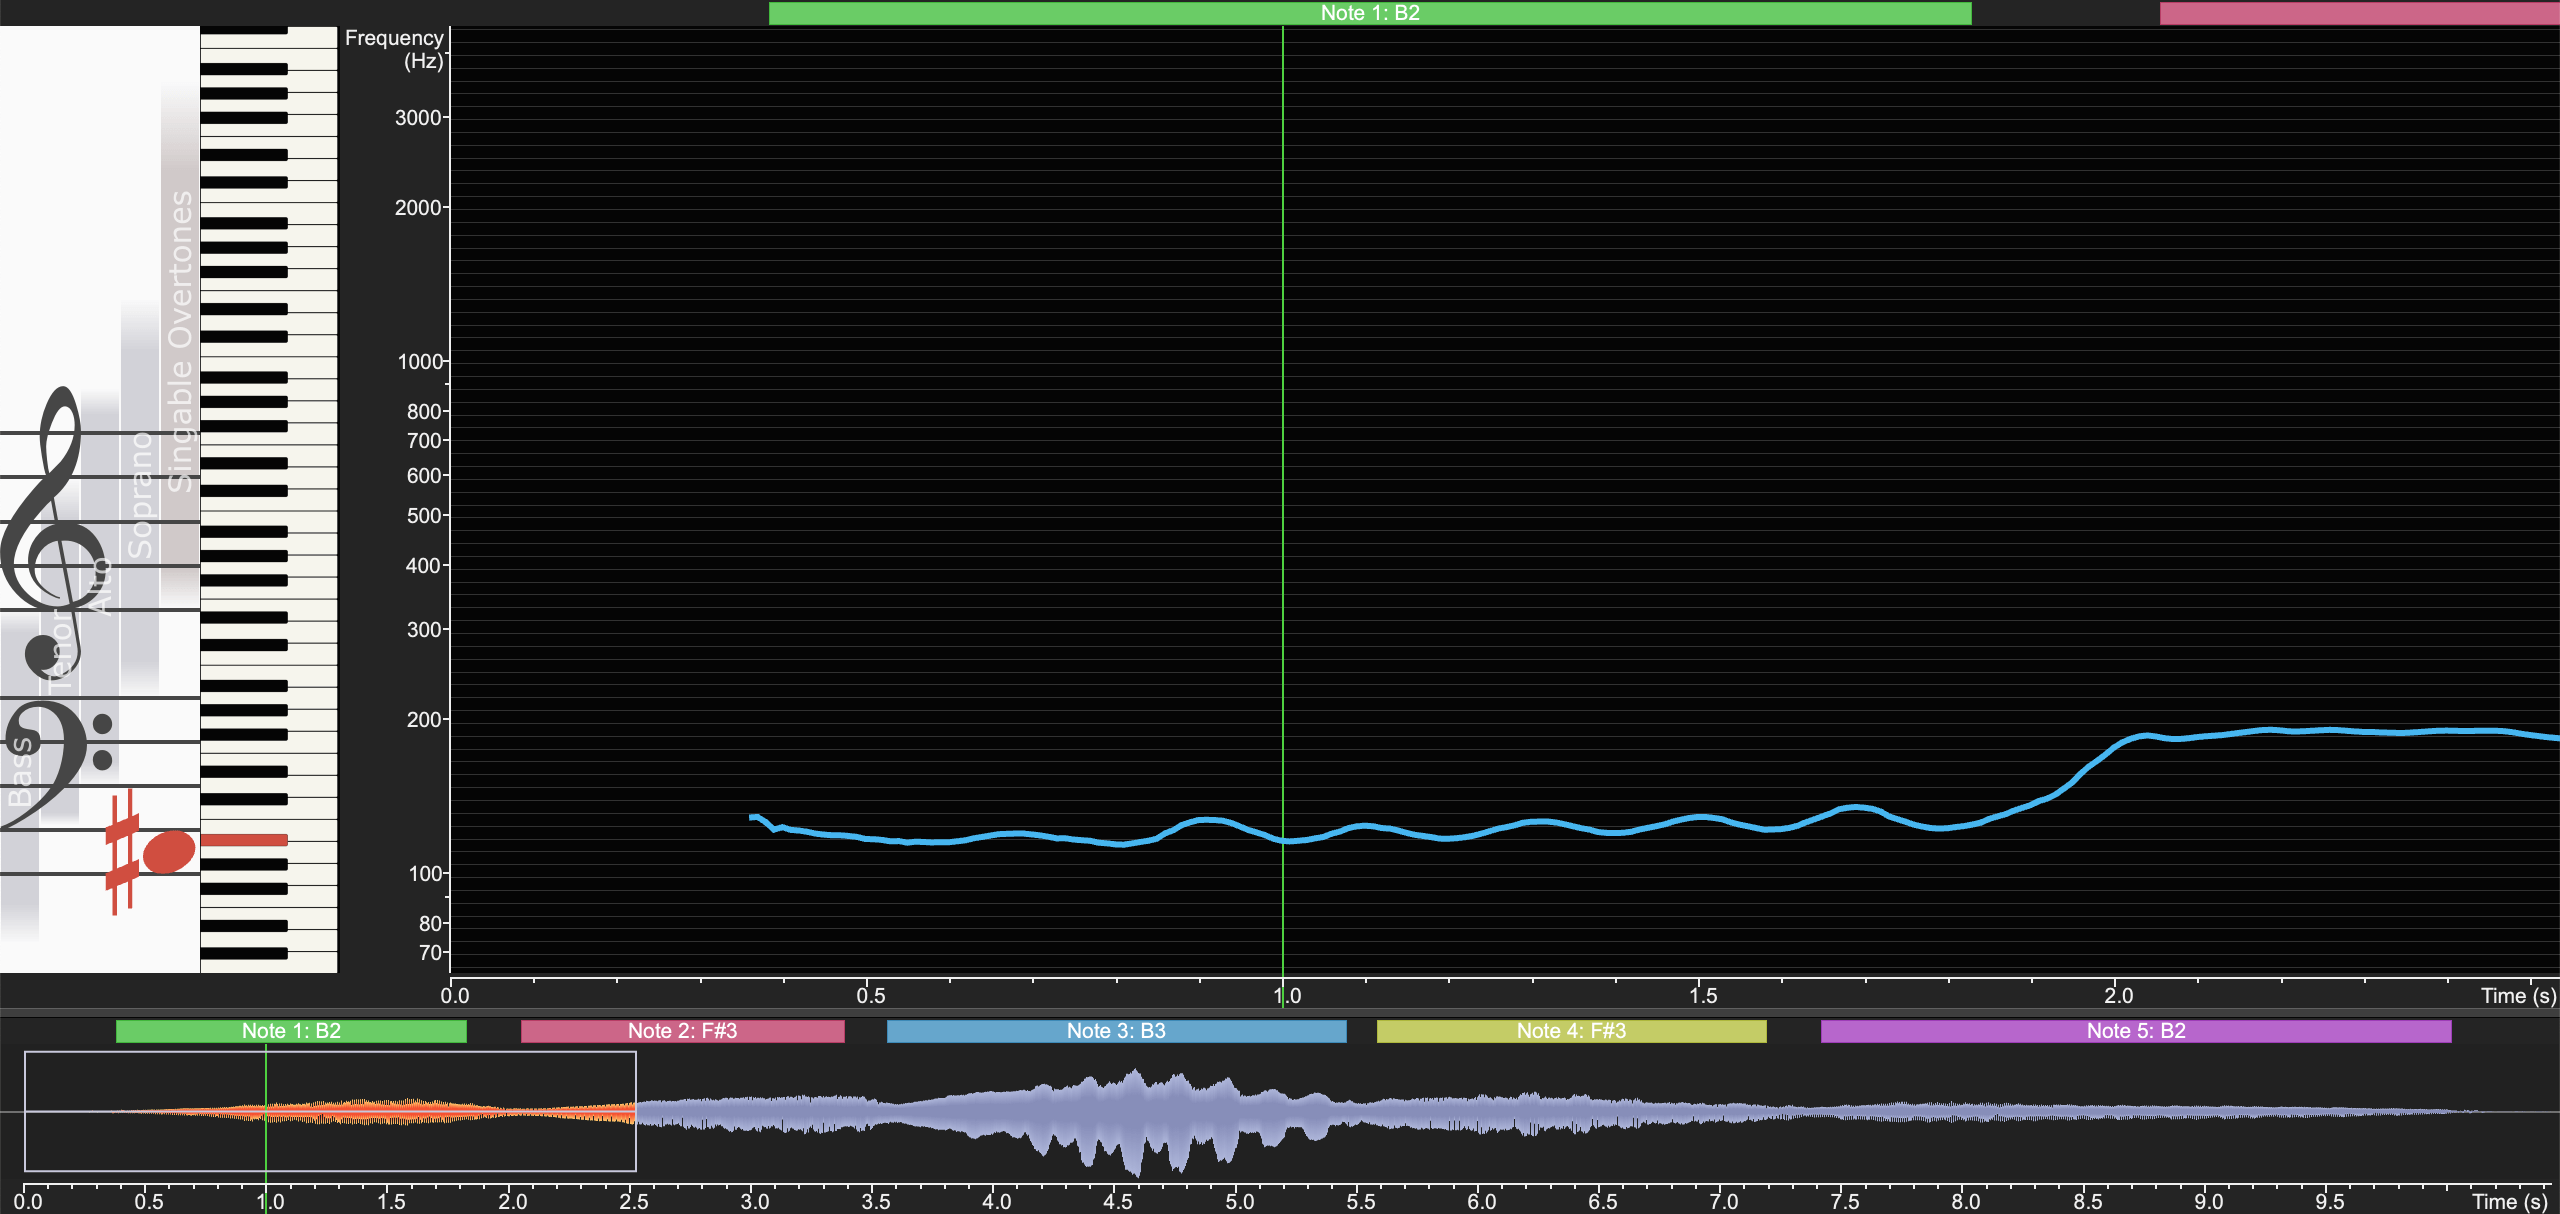
Besides using the menu command to zoom in, you can also move the pointer over the main window and use the two-finger scroll gesture on your trackpad, or the wheel on your mouse, to zoom in and out.
Zoom in frequency
We have zoomed the time scale so that the first sung note is stretched out over most of the visible time range. Now we want to zoom in the frequency range to see more details about the sung pitch on the frequency axis.
Move the pointer over the Frequency Scale just to the right of the piano keyboard. When pointing at the Frequency Scale, a grey horizontal line appears as a visual aid. Move the pointer so that the grey line is approximately matching the blue pitch line, and then use the two-finger scroll gesture on your trackpad, or rotate the wheel on your mouse, or press the 1 and 2 keys on your keyboard, to zoom in the visible frequency range to go approximately from notes A2 to A3 on the Piano, or 110 Hz to 220 Hz on the Frequency Scale:
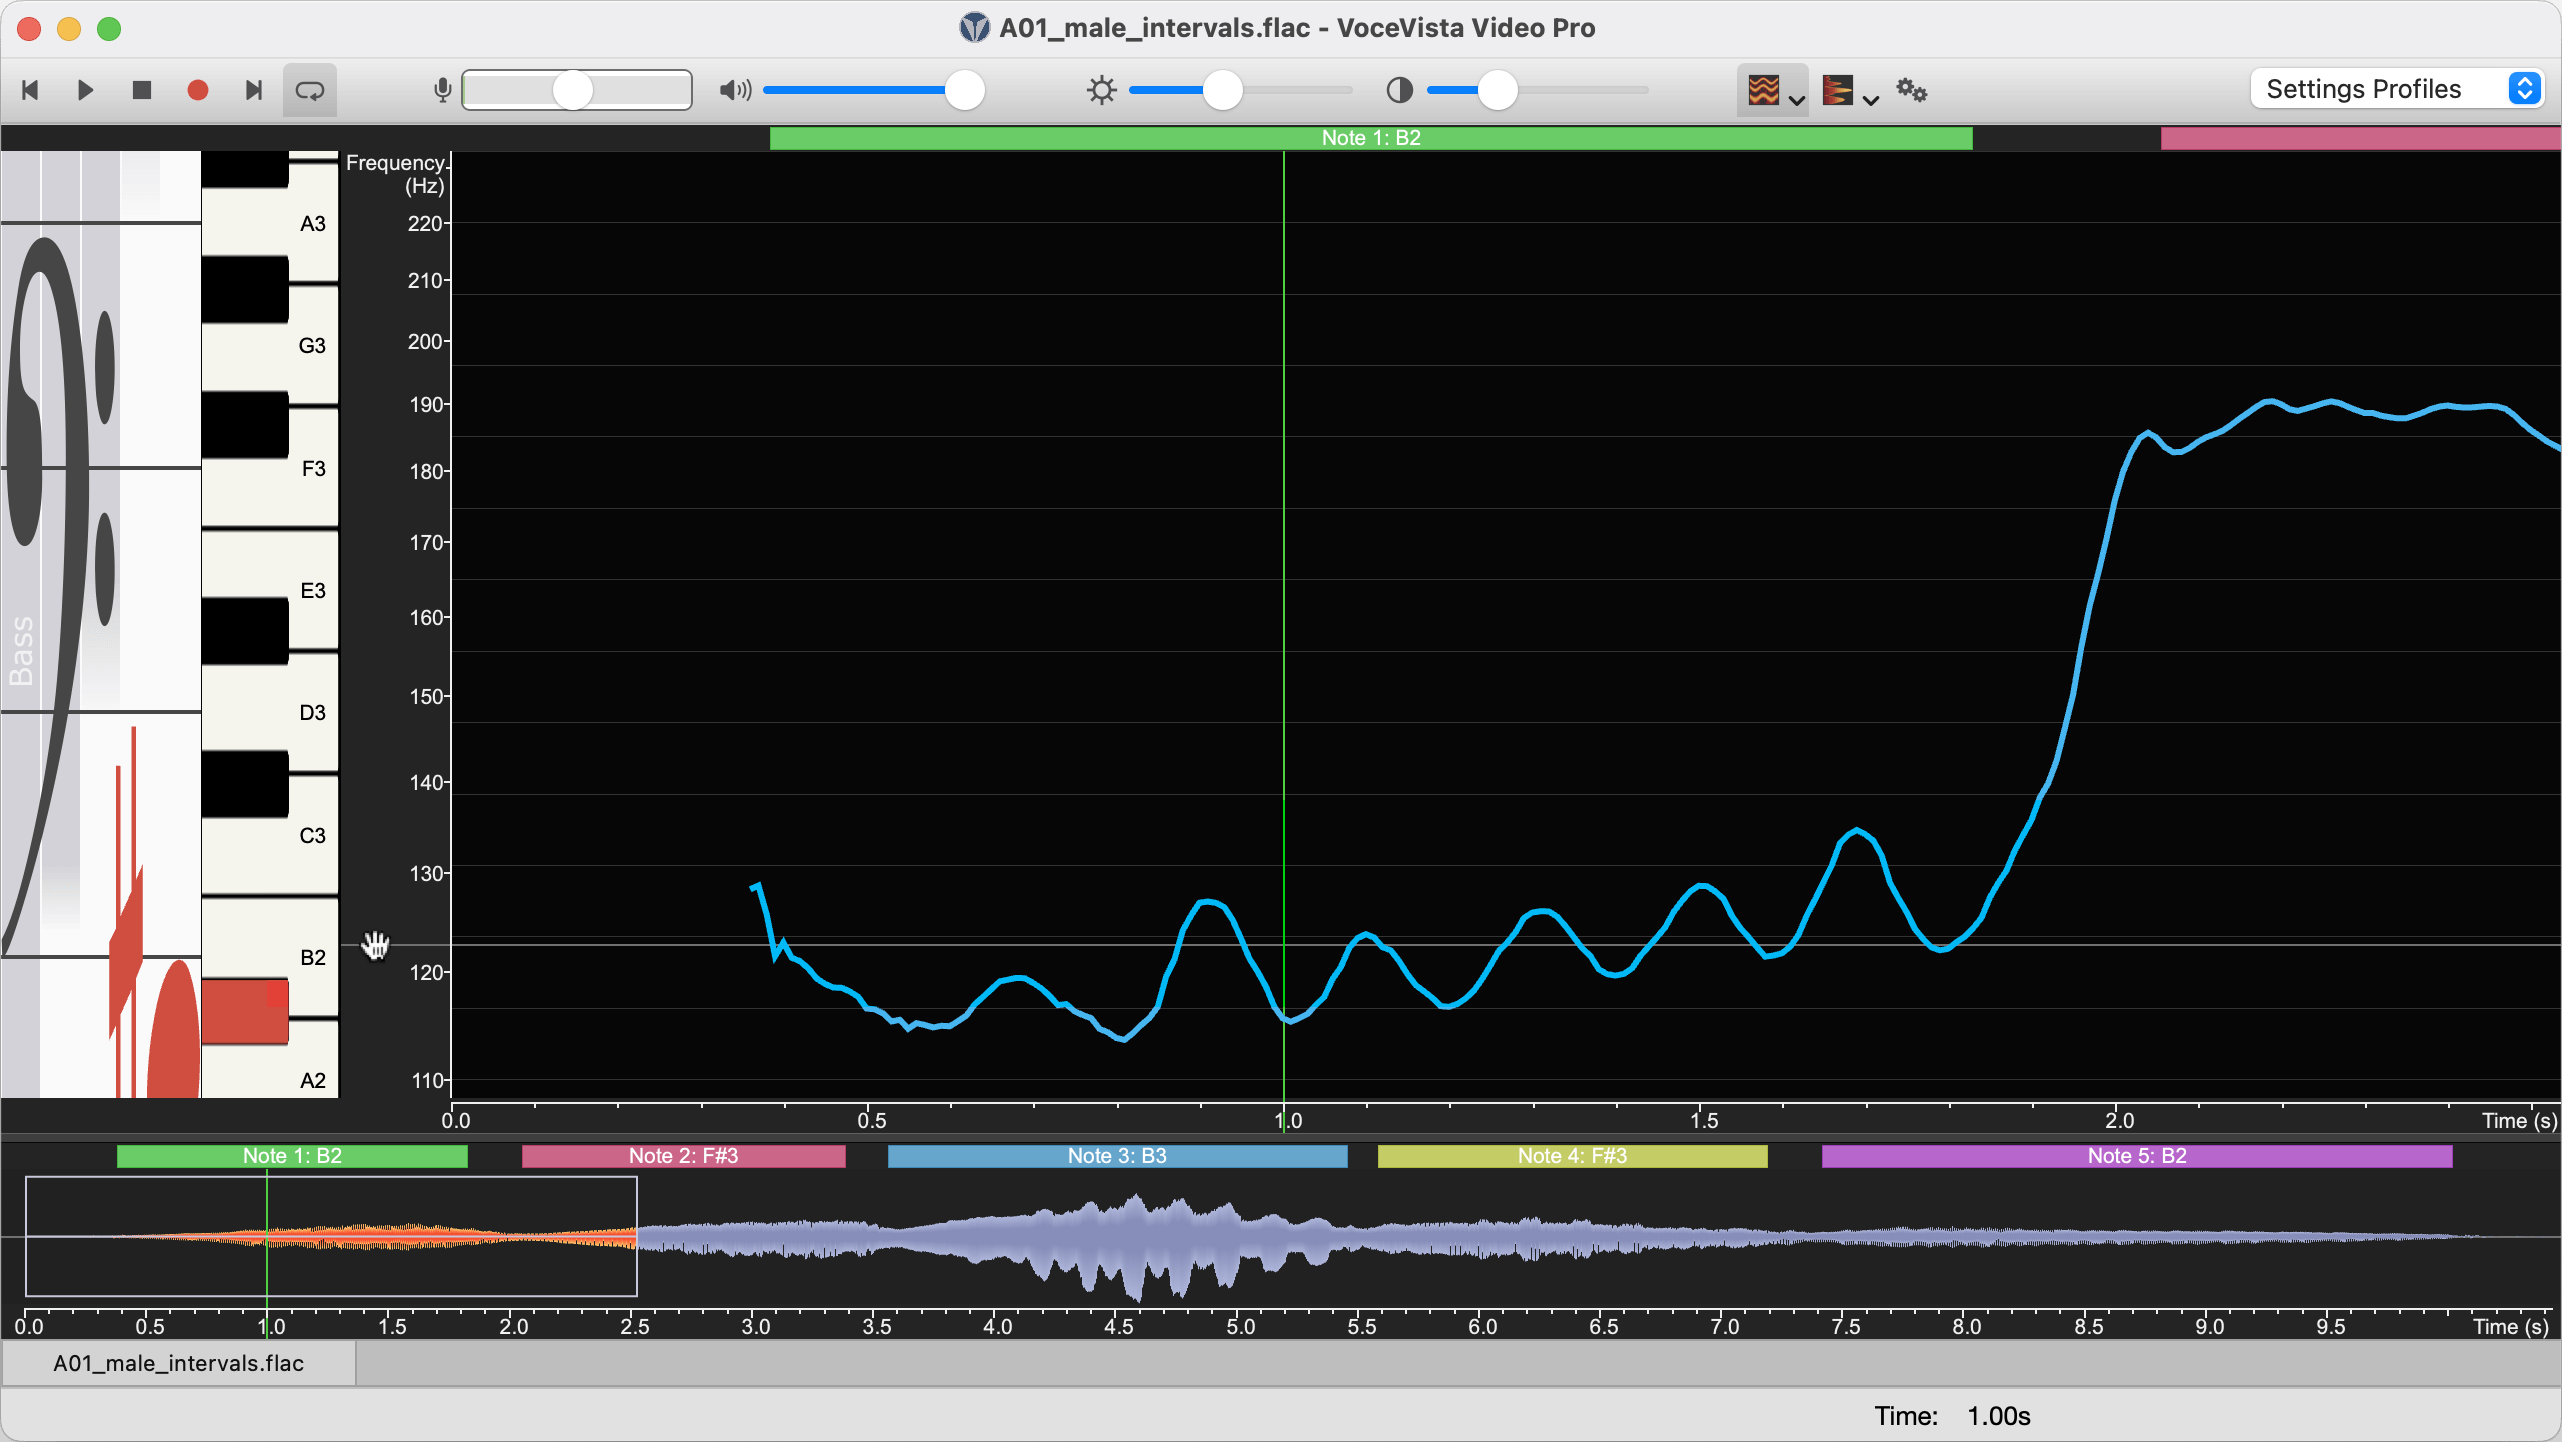
Notice how the blue line is not straight, but is slightly moving up and down. This is due to the vibrato of the singing voice. Also, it looks like the pitch is rising slightly throughout the duration of the note. VoceVista offers many ways to analyze this in more detail, but for now we will continue with the fundamentals of using the program.
Scroll visible time range
Now let’s look at other parts of the recording. Move the pointer over the center of the Time-Range Slider on the Timeline until it changes into a hand. Then click and drag this slider with the mouse until the second note has been scrolled into view:

Another way to scroll time is simply to click anywhere on the Timeline to move the current range to that position. Try that now: Move the pointer over the Timeline, at around 4.5 seconds, and make a single click. This should move the time range to cover the third note. However, now the pitch of the third note is no longer in view. So point at the Frequency Scale and drag it down a bit until the pitch line is in view again:
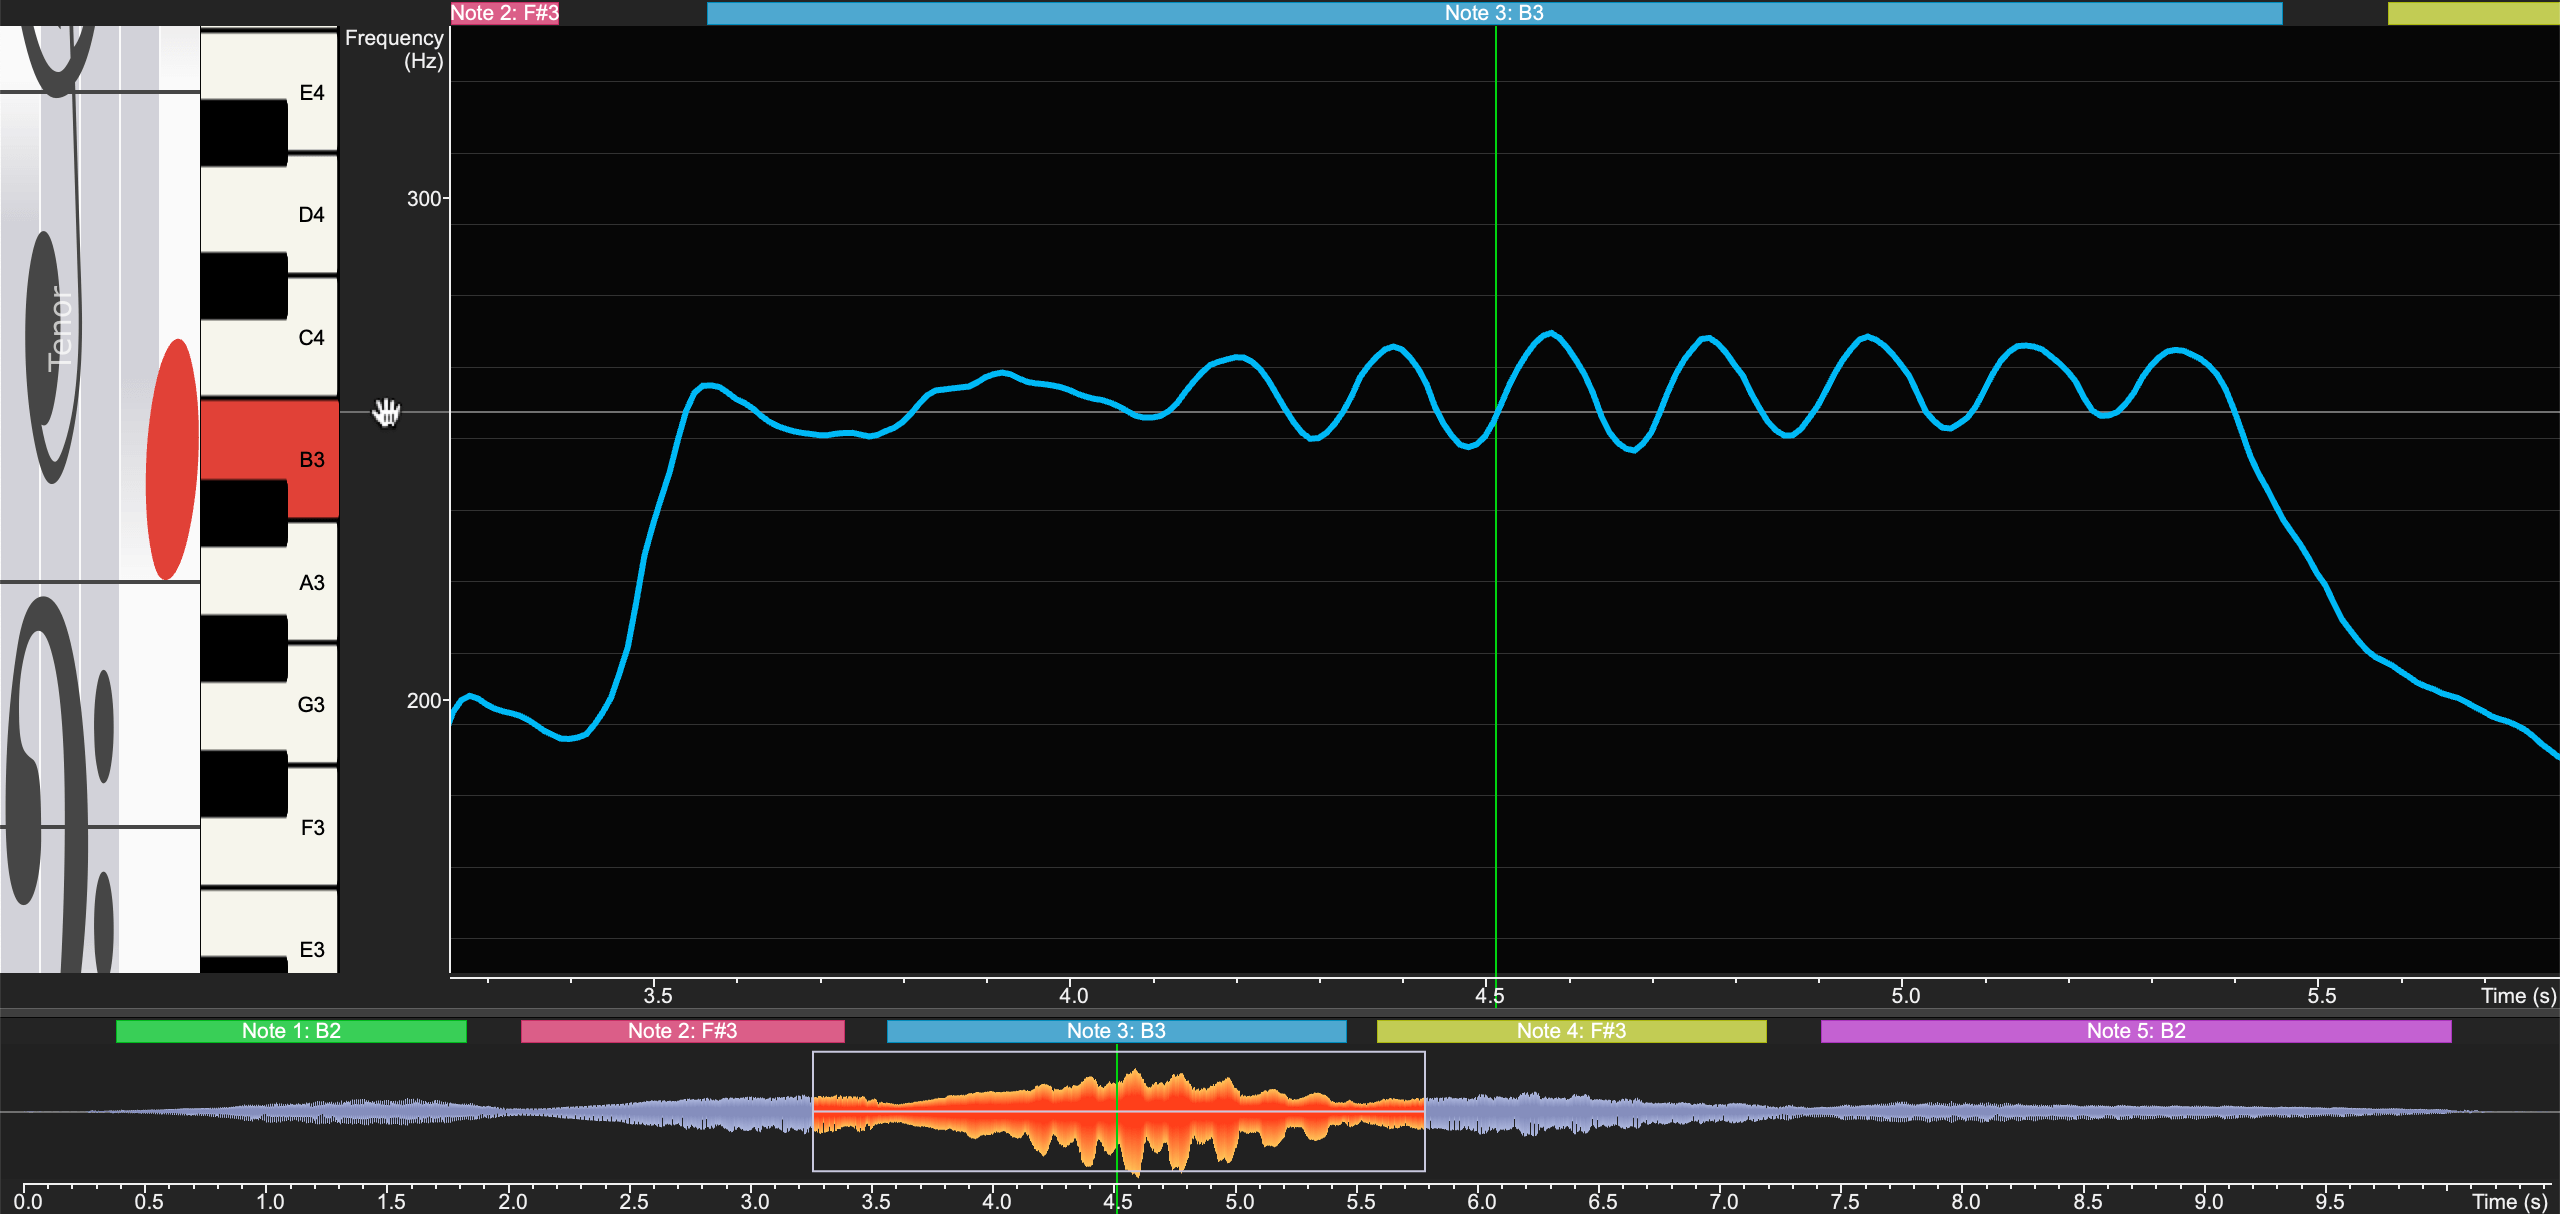
So far we have set the visible ranges on the time and frequency axes by simply scrolling and zooming those axes with the mouse, and by interacting with the Timeline. If you want to set a specific frequency range, you can use the Frequency Scale Settings. To set a specific time range, you can click on the menu to select a specific time range, and then click on .
Play selection
In the last section we have played back the entire recording. But let’s say that we are interested in a specific part of the recording and want to repeat it a few times in a loop. To do that, you can select a time range by holding the Command key (on Mac) or the Control key (on PC), and then clicking and dragging the pointer over the time range that you want to select.
Do this now: Hold Command (or Control on PC), and then click on the pitch line at 3.5 seconds, and while holding the mouse button, drag the pointer to 5.5 seconds, and then release it. This should select the time range that encompasses the third note:
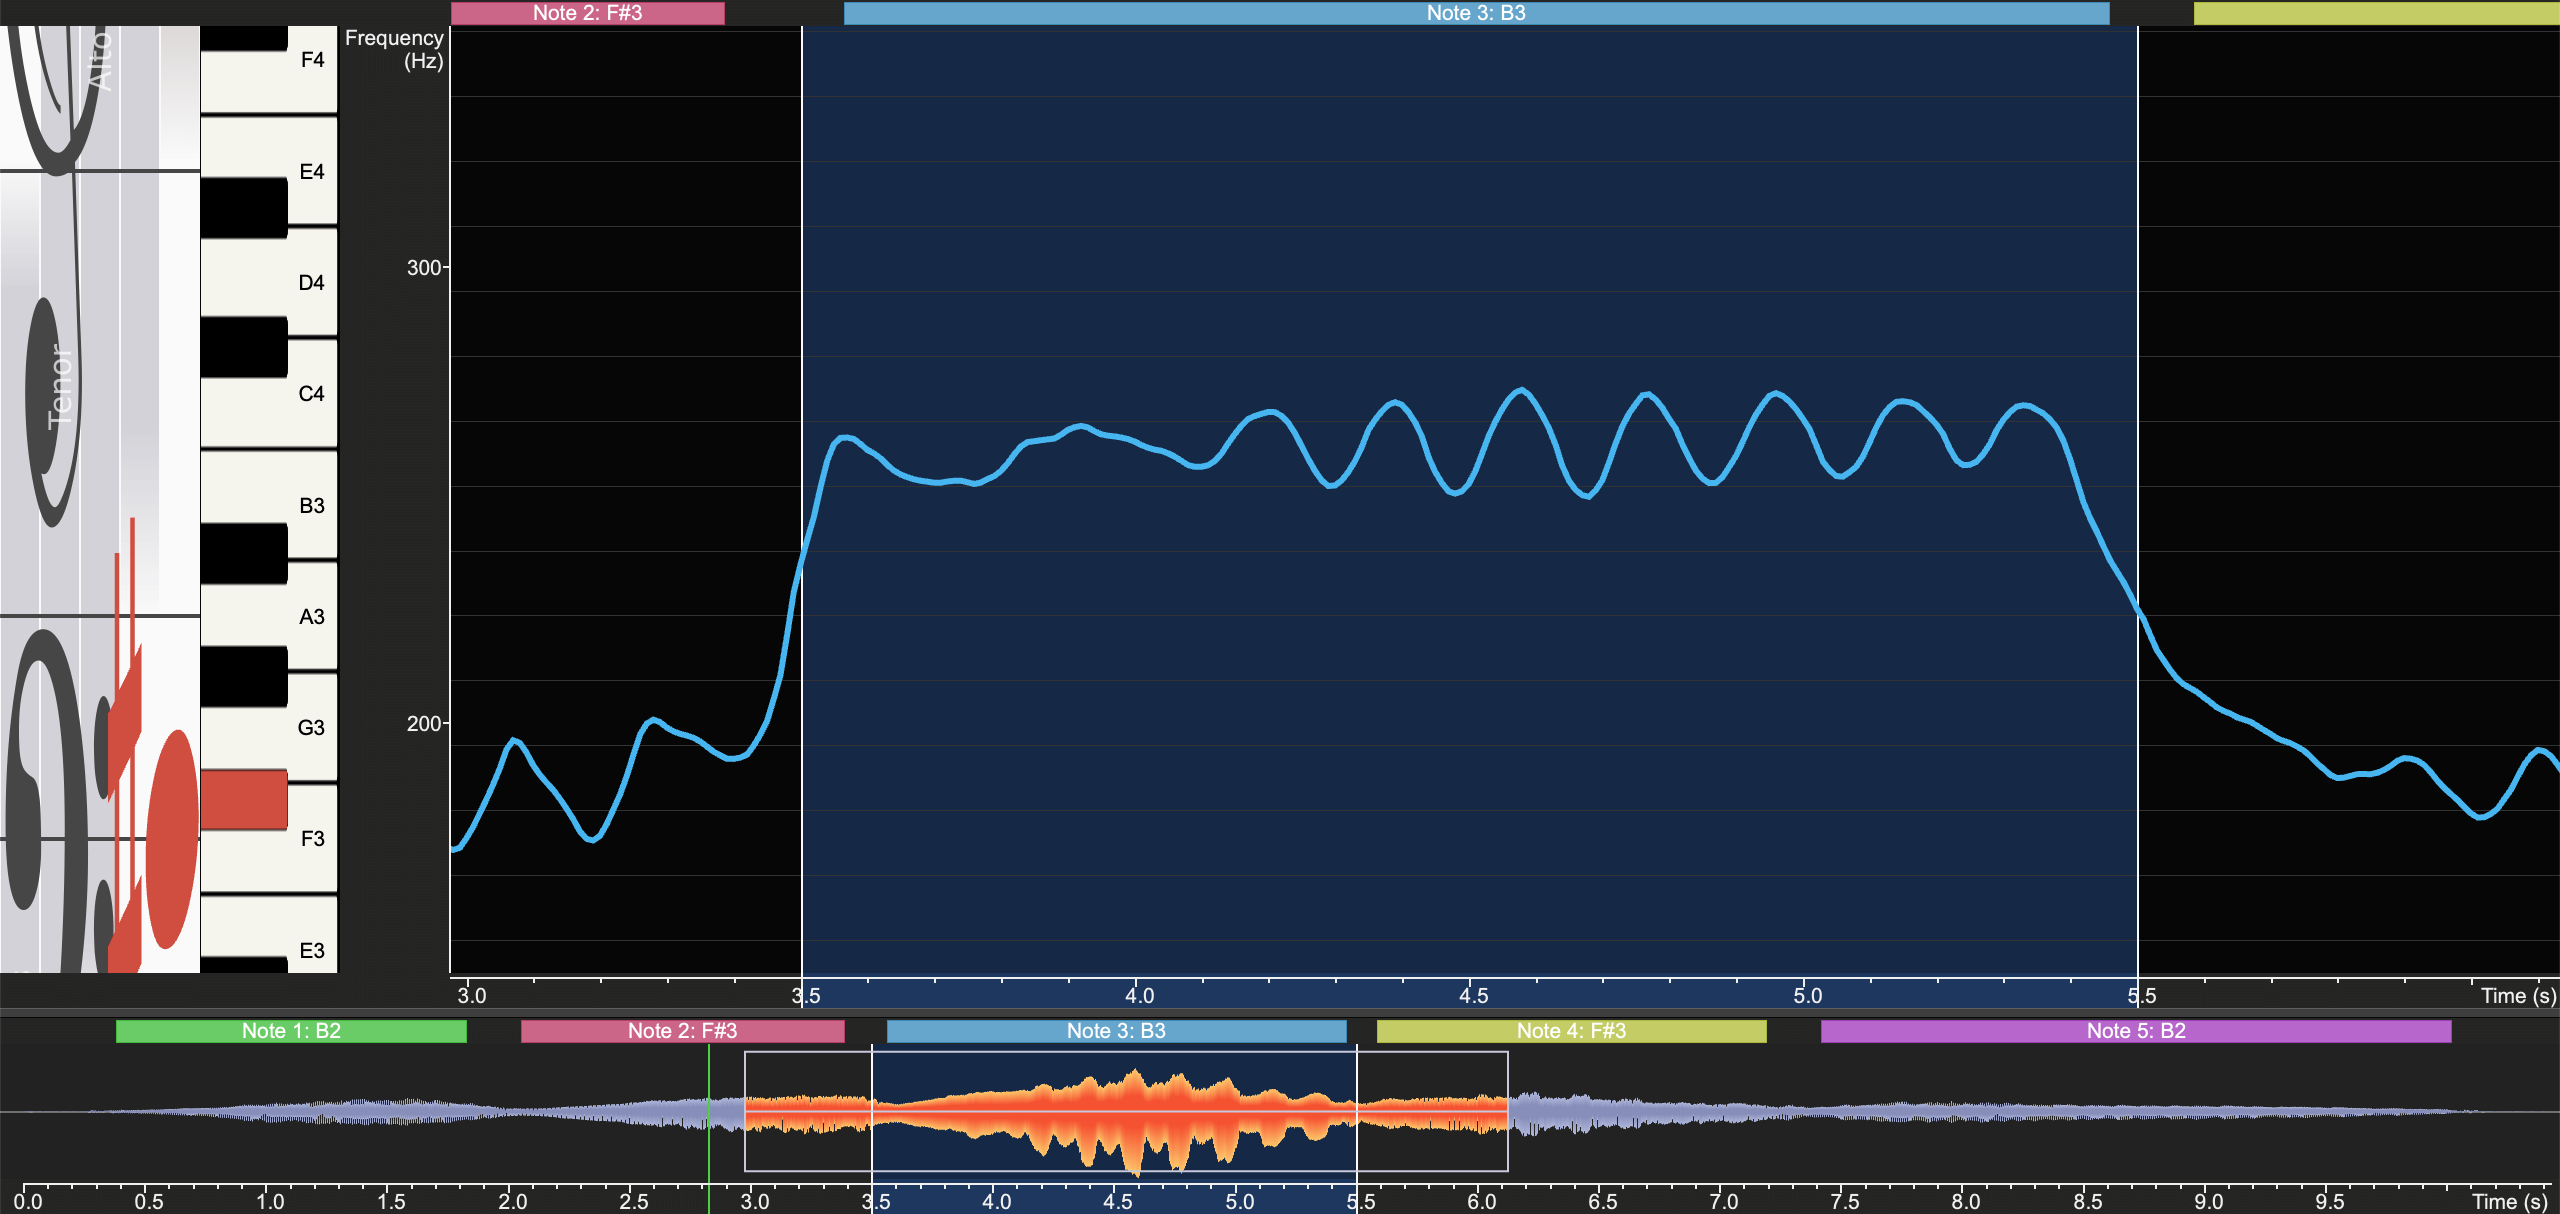
Now you can press Space to play the current selection. If the loop button on the toolbar is pressed, the selection will repeat until you stop playback. Try to move the edges of the selection with the mouse. This can be done even during playback.
Selecting a time range is not just for looping playback, but also for using this range for further analysis and averaging, and to apply edit commands.
To reset the selected time range, hold Command / Control and single-click anywhere in the main window. Alternatively, you can also invoke the menu .
Spectrogram & Spectrum
So far we’ve only looked at the pitch line, which shows the fundamental
pitch of the recording. Now let’s look at the Spectrogram, which shows
how loud the recording is at each point of the frequency range. Click on
the Settings button on the toolbar
, and
then select Analyzer View on the left, and Acoustic on the top, to
open the Analyzer View settings page:

Check the Spectrogram option on the left column, just under Long-term view. Then close the settings window.
Now you should already see the Spectrogram, but the screen might still be zoomed in very far from the previous step. On the toolbar, click on Settings Profiles and select the Standard Frequency Range profile. Then click on . Now your screen should look similar to this:
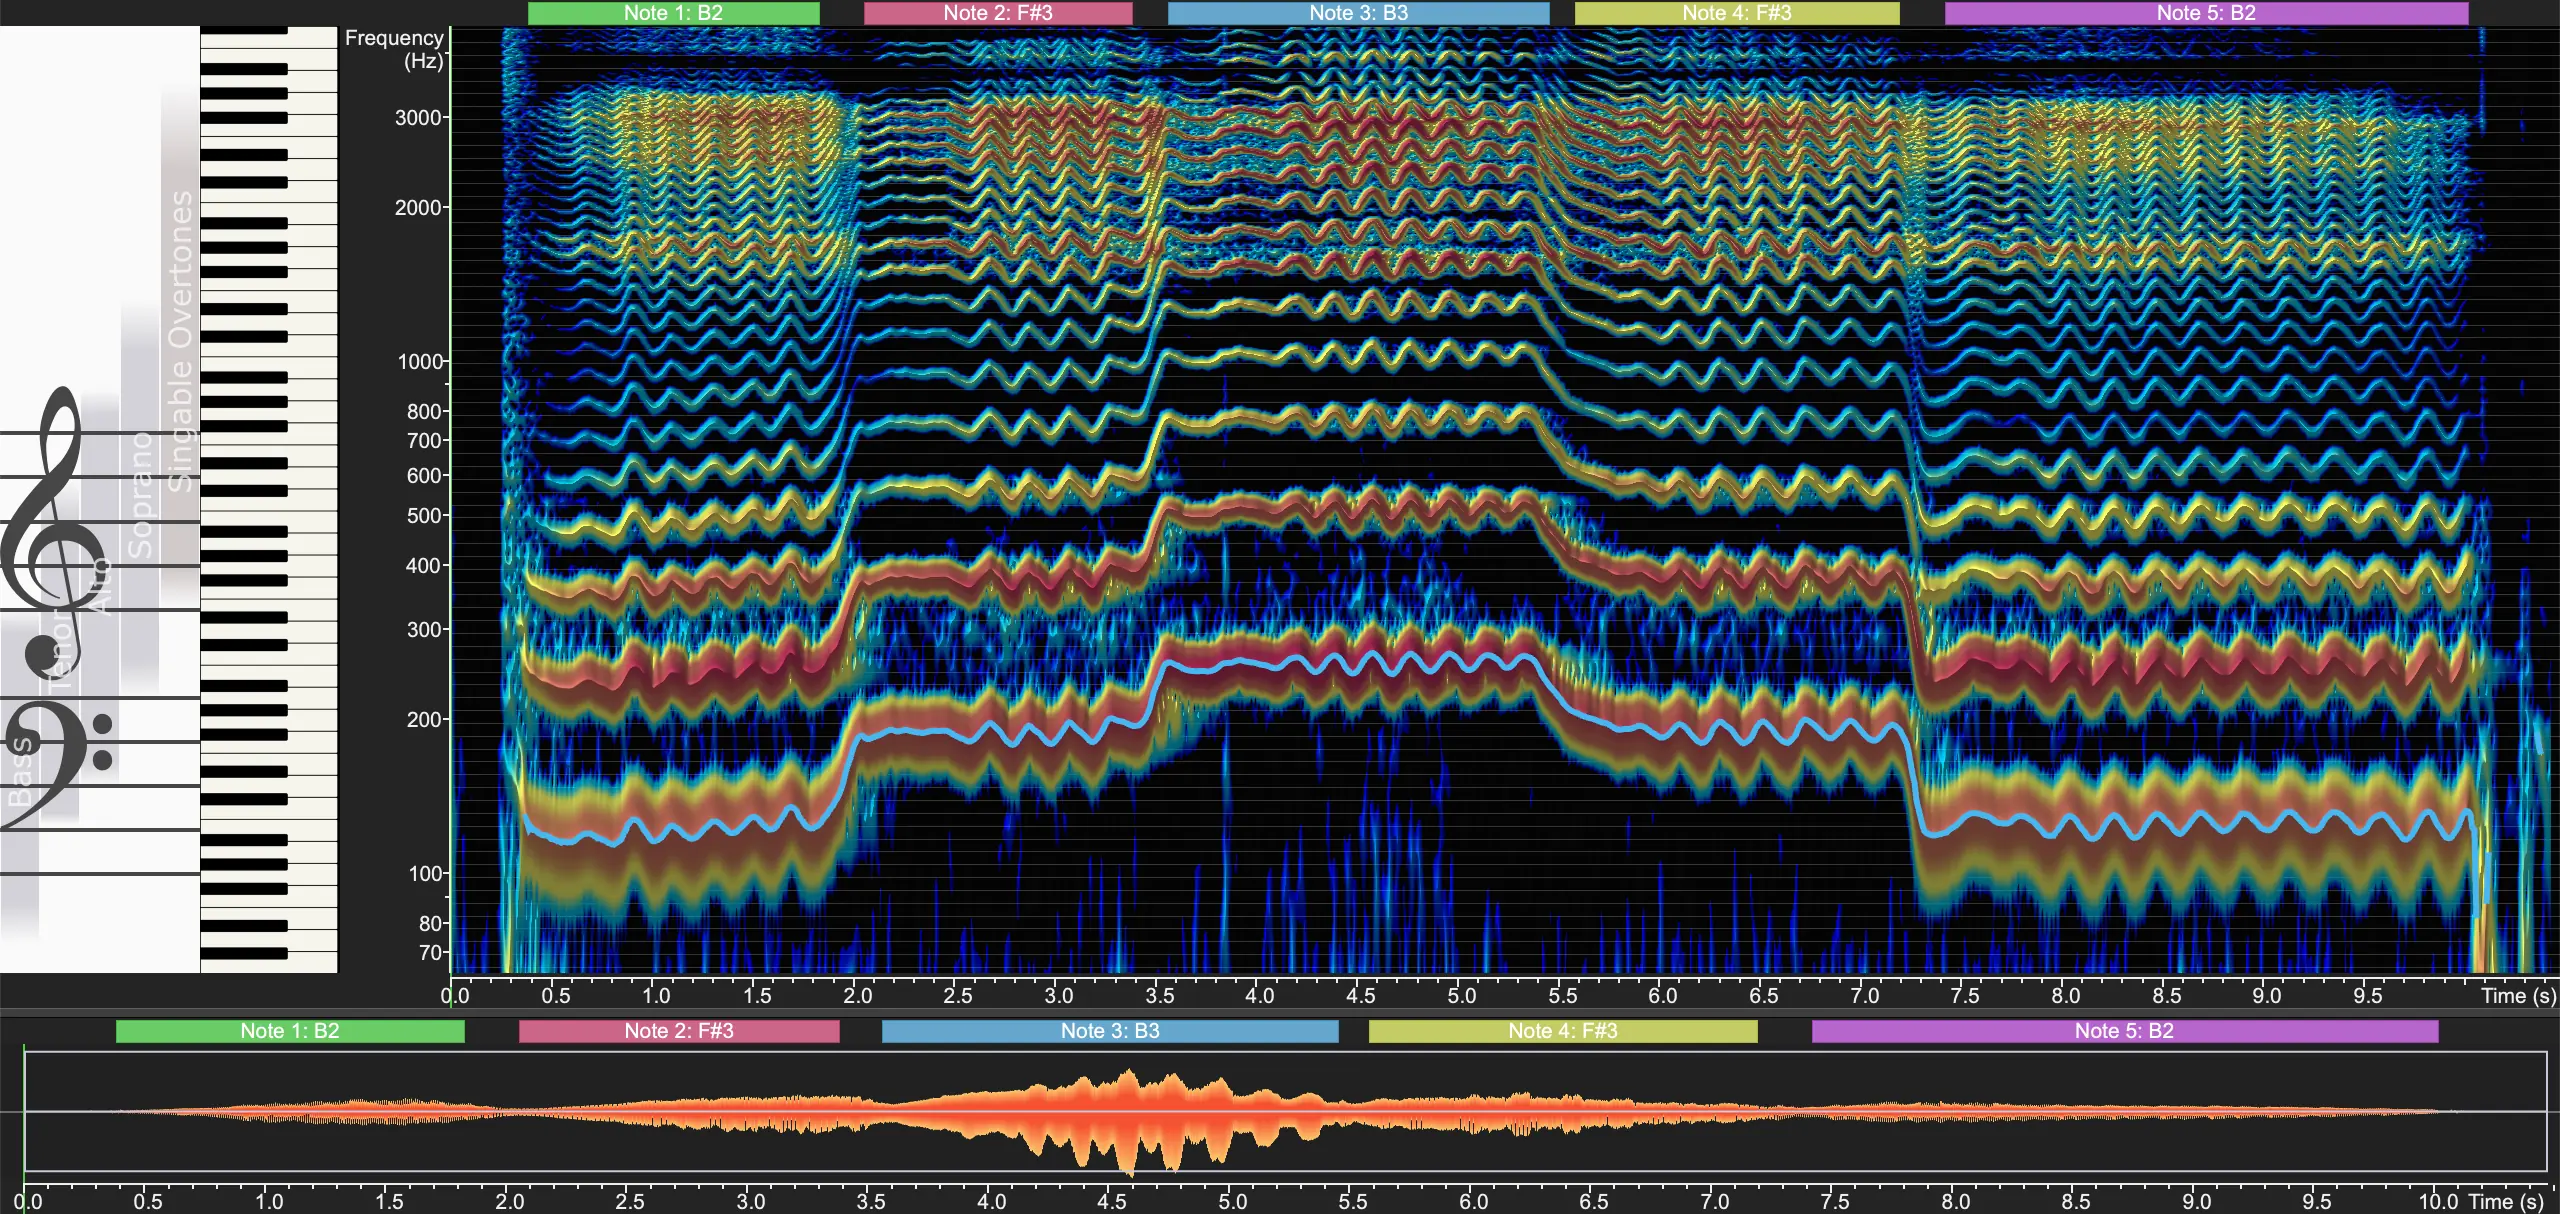
The colors on the spectrogram indicate the intensity of the sound for each frequency. In other words, the spectrogram shows which frequencies are in the sound, and how loud they are. To see this in more detail at any given point in time, we can enable the Short-Term view, and in particular, the Spectrum. Reopen the Analyzer View settings page and check the Short-Term view and Spectrum options.
Now the screen is split into two parts. The left side contains the Long-Term view, which hows how the recording changes over time. The right side contains the Short-Term view, which shows details of the recording at the specific point in time where the green time cursor line is located. Move the pointer around over the spectrum with the mouse button held down, and observe how the spectrum changes as you move the cursor to different time positions. Now move the green cursor line to 8.0 seconds.
Move the brightness slider on the toolbar (as shown on Toolbar buttons) and see how the dynamic range of the spectrum and spectrogram changes in response to that. Adjust the brightness slider so that all peaks on the spectrum are fully visible. Then point at some of the spectral peaks on the right side and see how the text display on the Short-Term view shows the current frequency, nearest musical note, and intensity, for each peak in the spectrum:
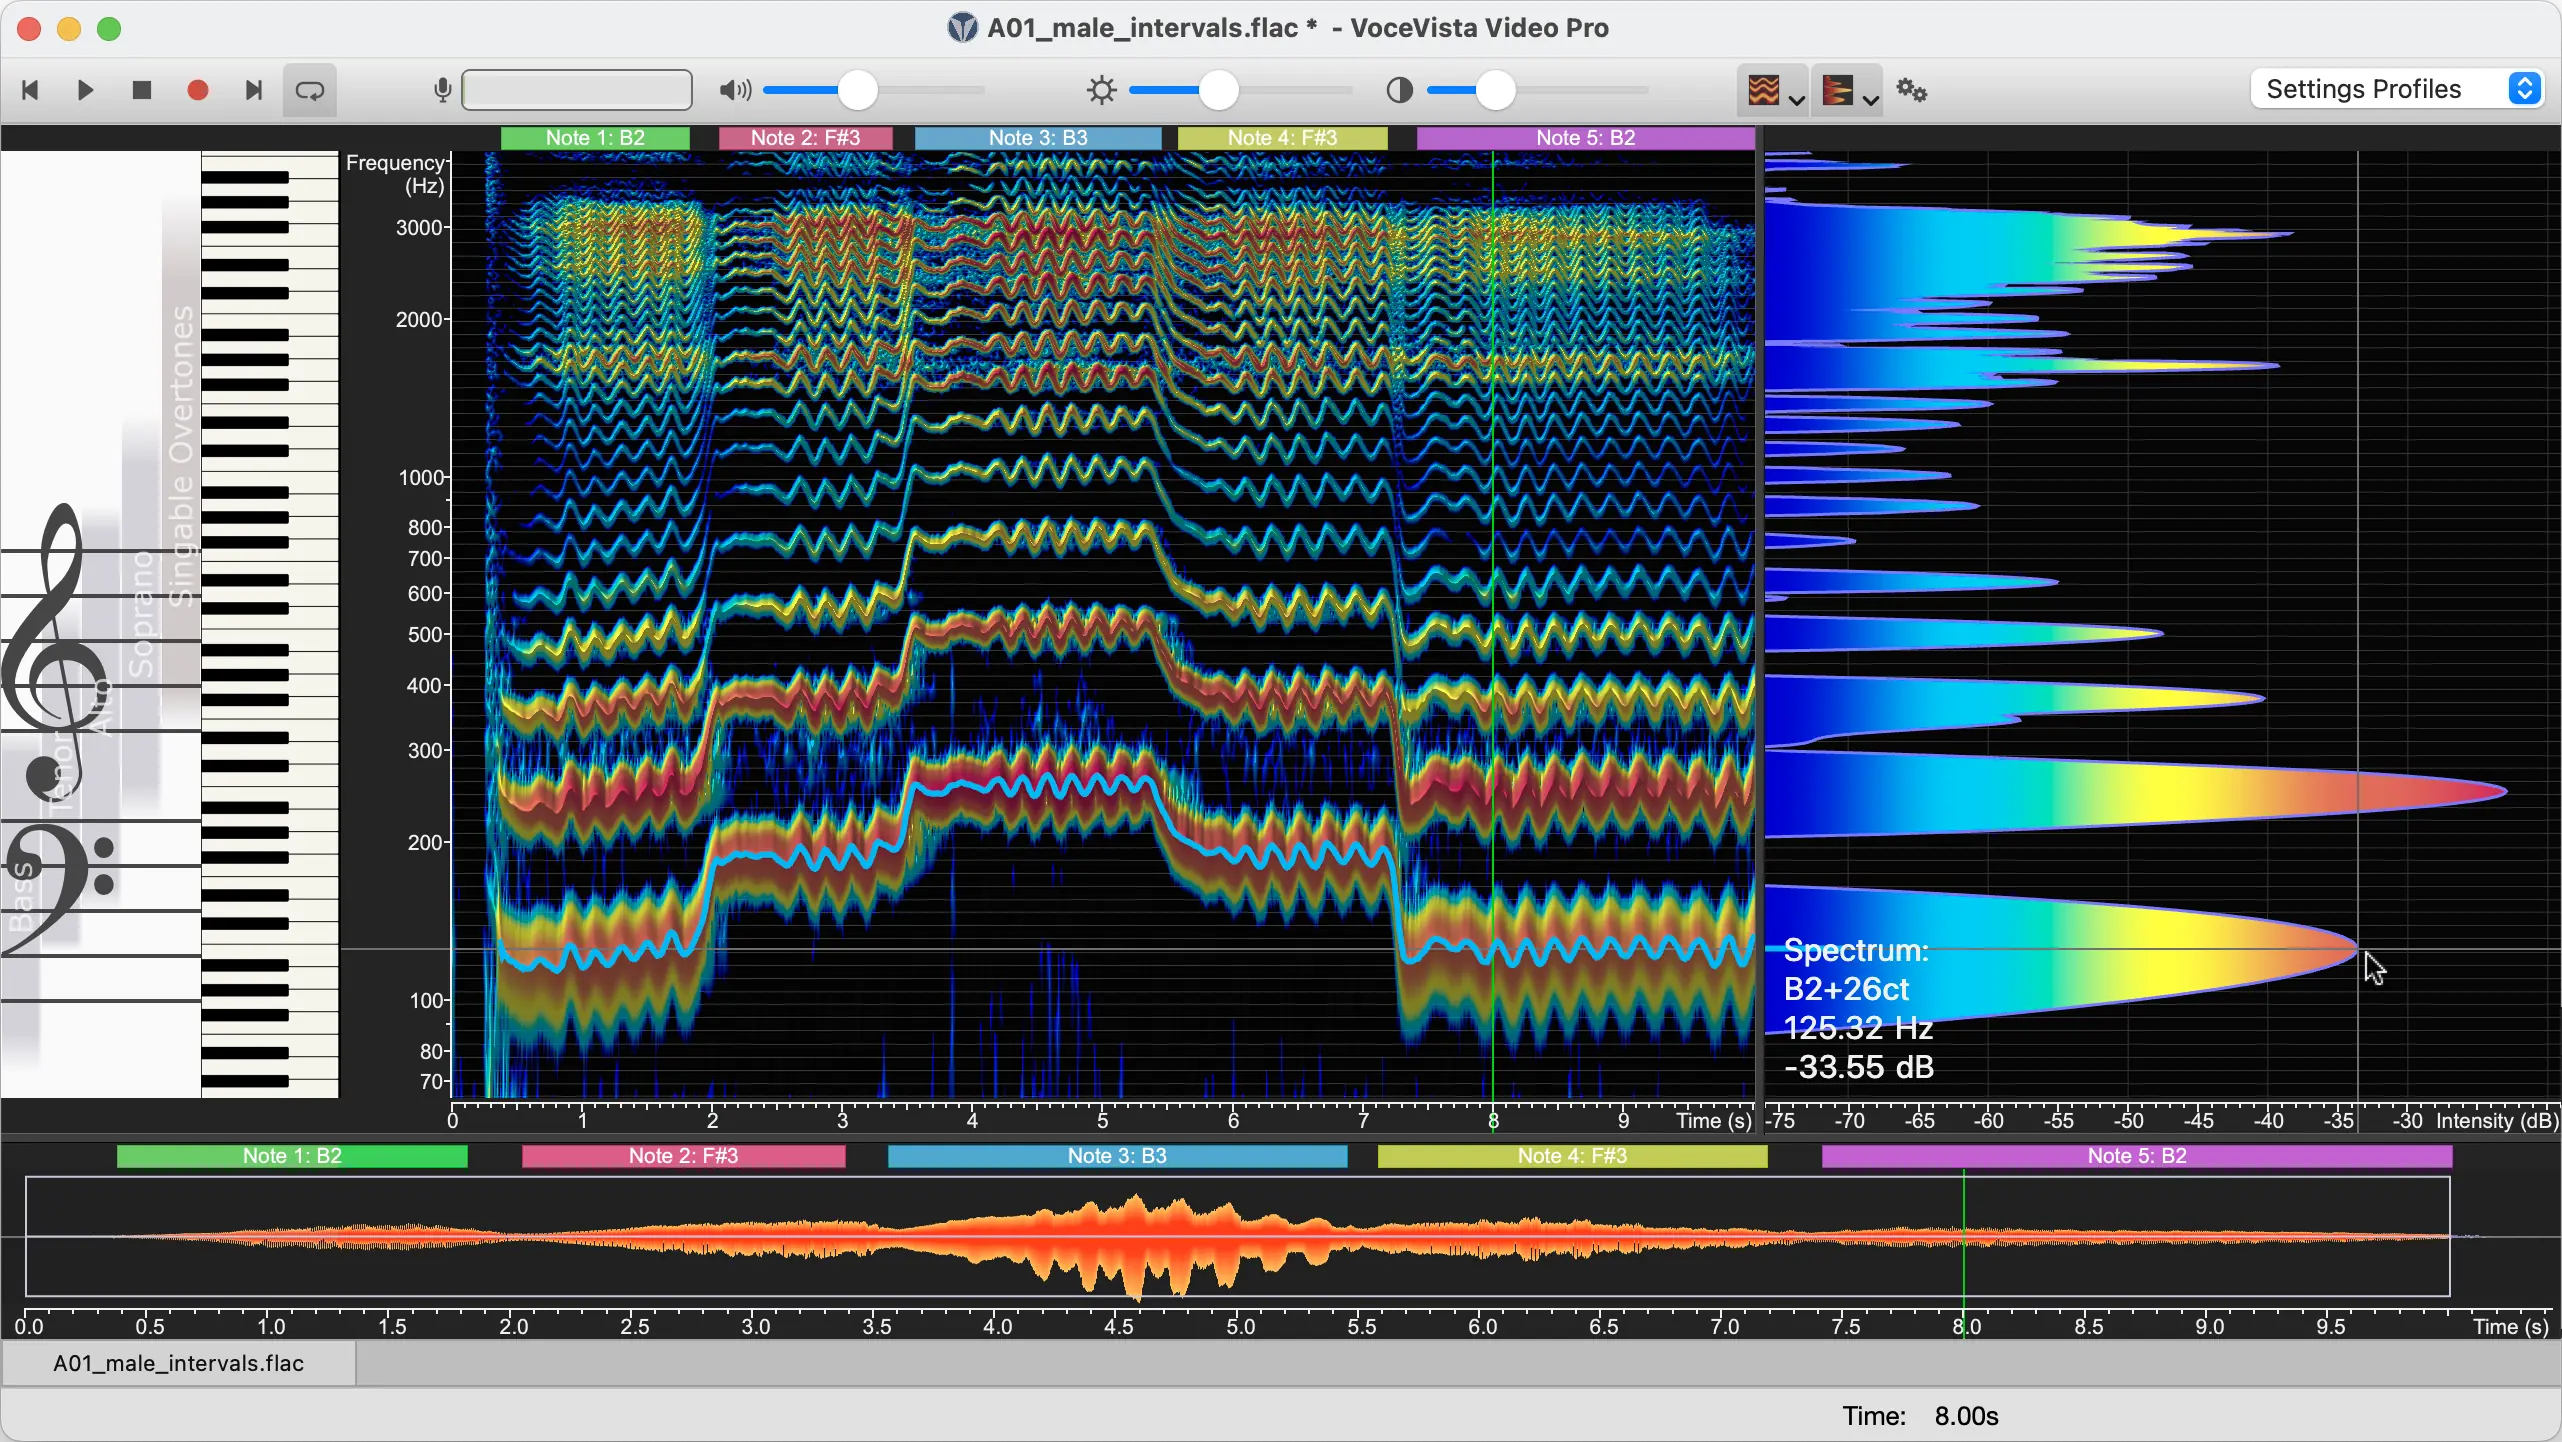
So now you can see the that the sound in our recording contains many individual frequency components that have different levels of intensity. These are the harmonics. To better understand what this means, let’s use another feature of VoceVista: the Frequency Filter.
Frequency Filter
|
Available in VoceVista Video and higher
Frequency Filters are only available in VoceVista Video and higher. |
Frequency Filters are a tool that allows to pick out specific frequency ranges and listen to them in isolation, or to change their intensity to make them louder or softer. This helps to understand the spectral composition of the recorded sound.
Continuing with the same sample file ("A01_male_intervals.flac"), select the time range that encompasses the voiced part of the last sung note (hence select the range from 7.5 s to 9.5 s), and center the view on this range. Adjust the visible frequency range so that the fundamental pitch of the note is at the bottom of the screen, and the part around 3000 Hz can be clearly seen (hence set the frequency range to something like 80 Hz - 4000 Hz).
Now click on . Your screen should now look like this:
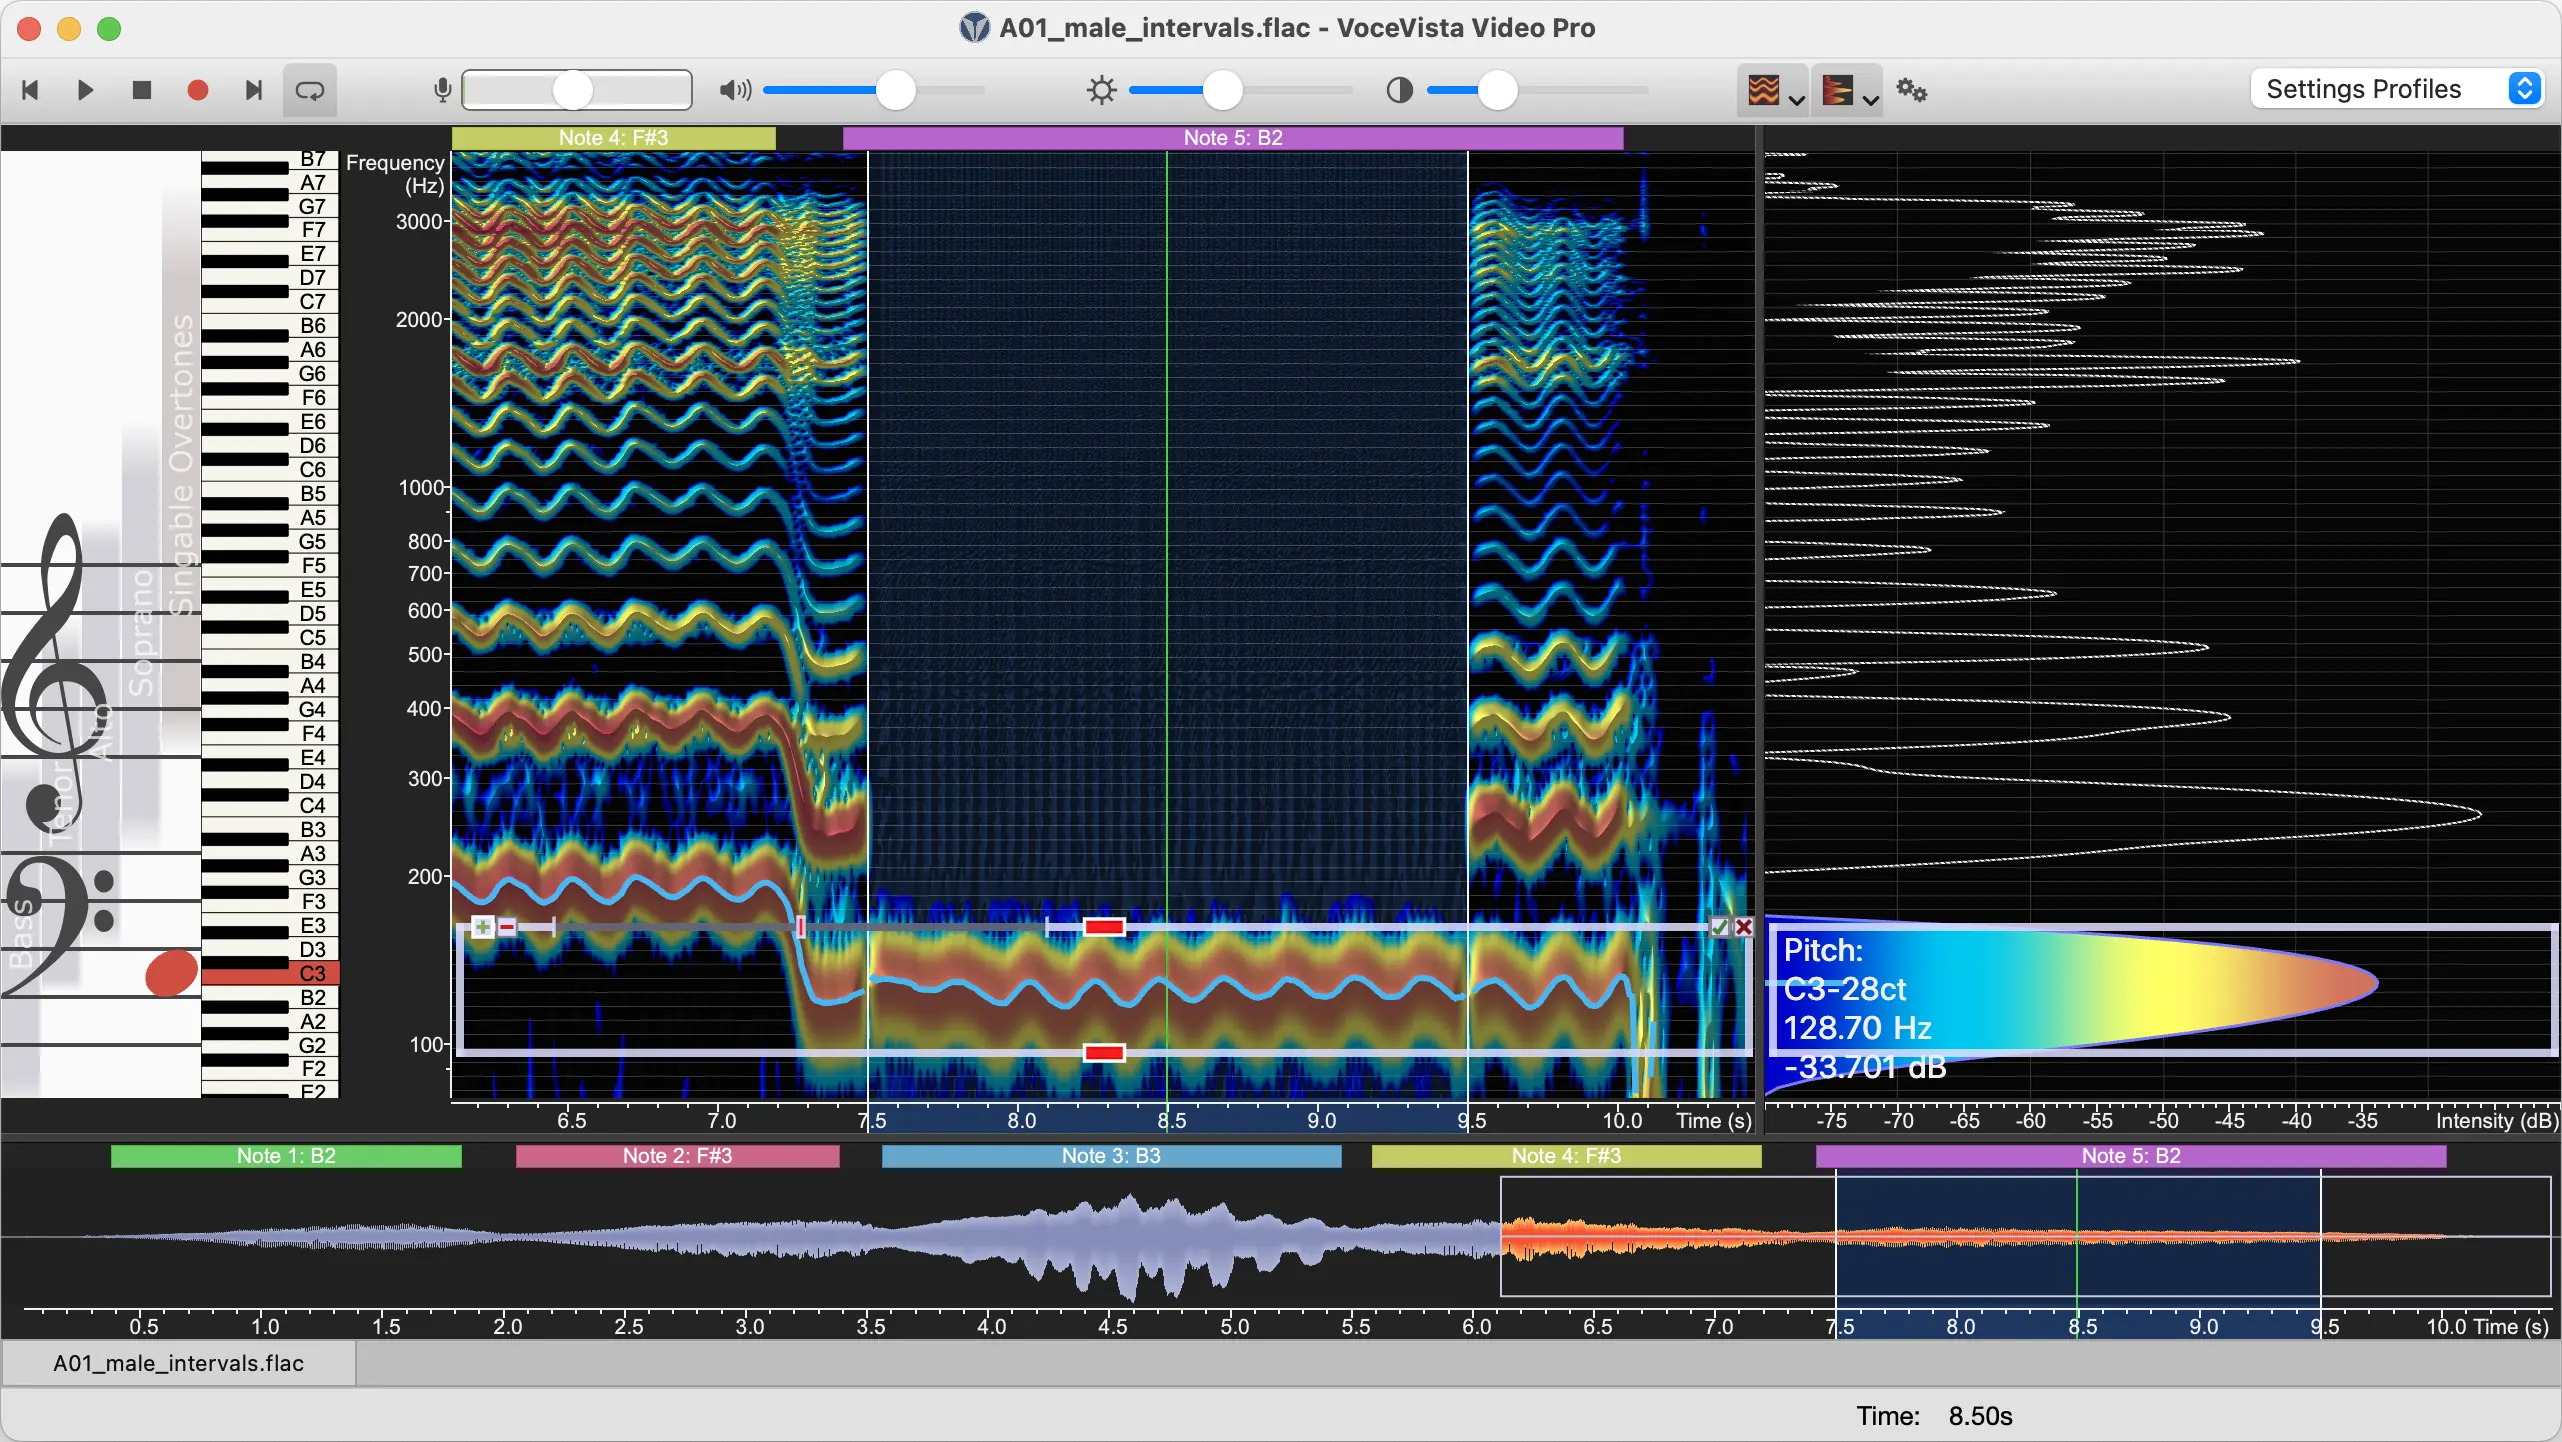
The grey frame at 100 Hertz is the Frequency Filter. It will remove all frequencies outside of its range. Check that the loop icon on the toolbar is pressed, and then start playback again and hear the effect of the filter. Then, while playback is running, move the filter up and down by dragging its grey frame with the mouse. You can change the width of the filter by dragging the red handles that appear when the mouse cursor hovers over the filter.
The spectrum on the right now shows a white outline of the original spectrum. The part in color is all that is left by the Frequency Filter. With this, you can listen to the individual harmonics or overtones in your sound.
Now click on to invert the filter. Instead of keeping only the frequencies inside of it, it now punches a hole in the spectrum by filtering out the frequencies in its range. To see this more clearly, set the brightness slider on the toolbar to -18 dB, and set the contrast slider to 60 dB. Drag the Frequency Filter to cover the range from 200 to 700 Hz, so that it removes the second, third, fourth and fifth harmonics in the recording:
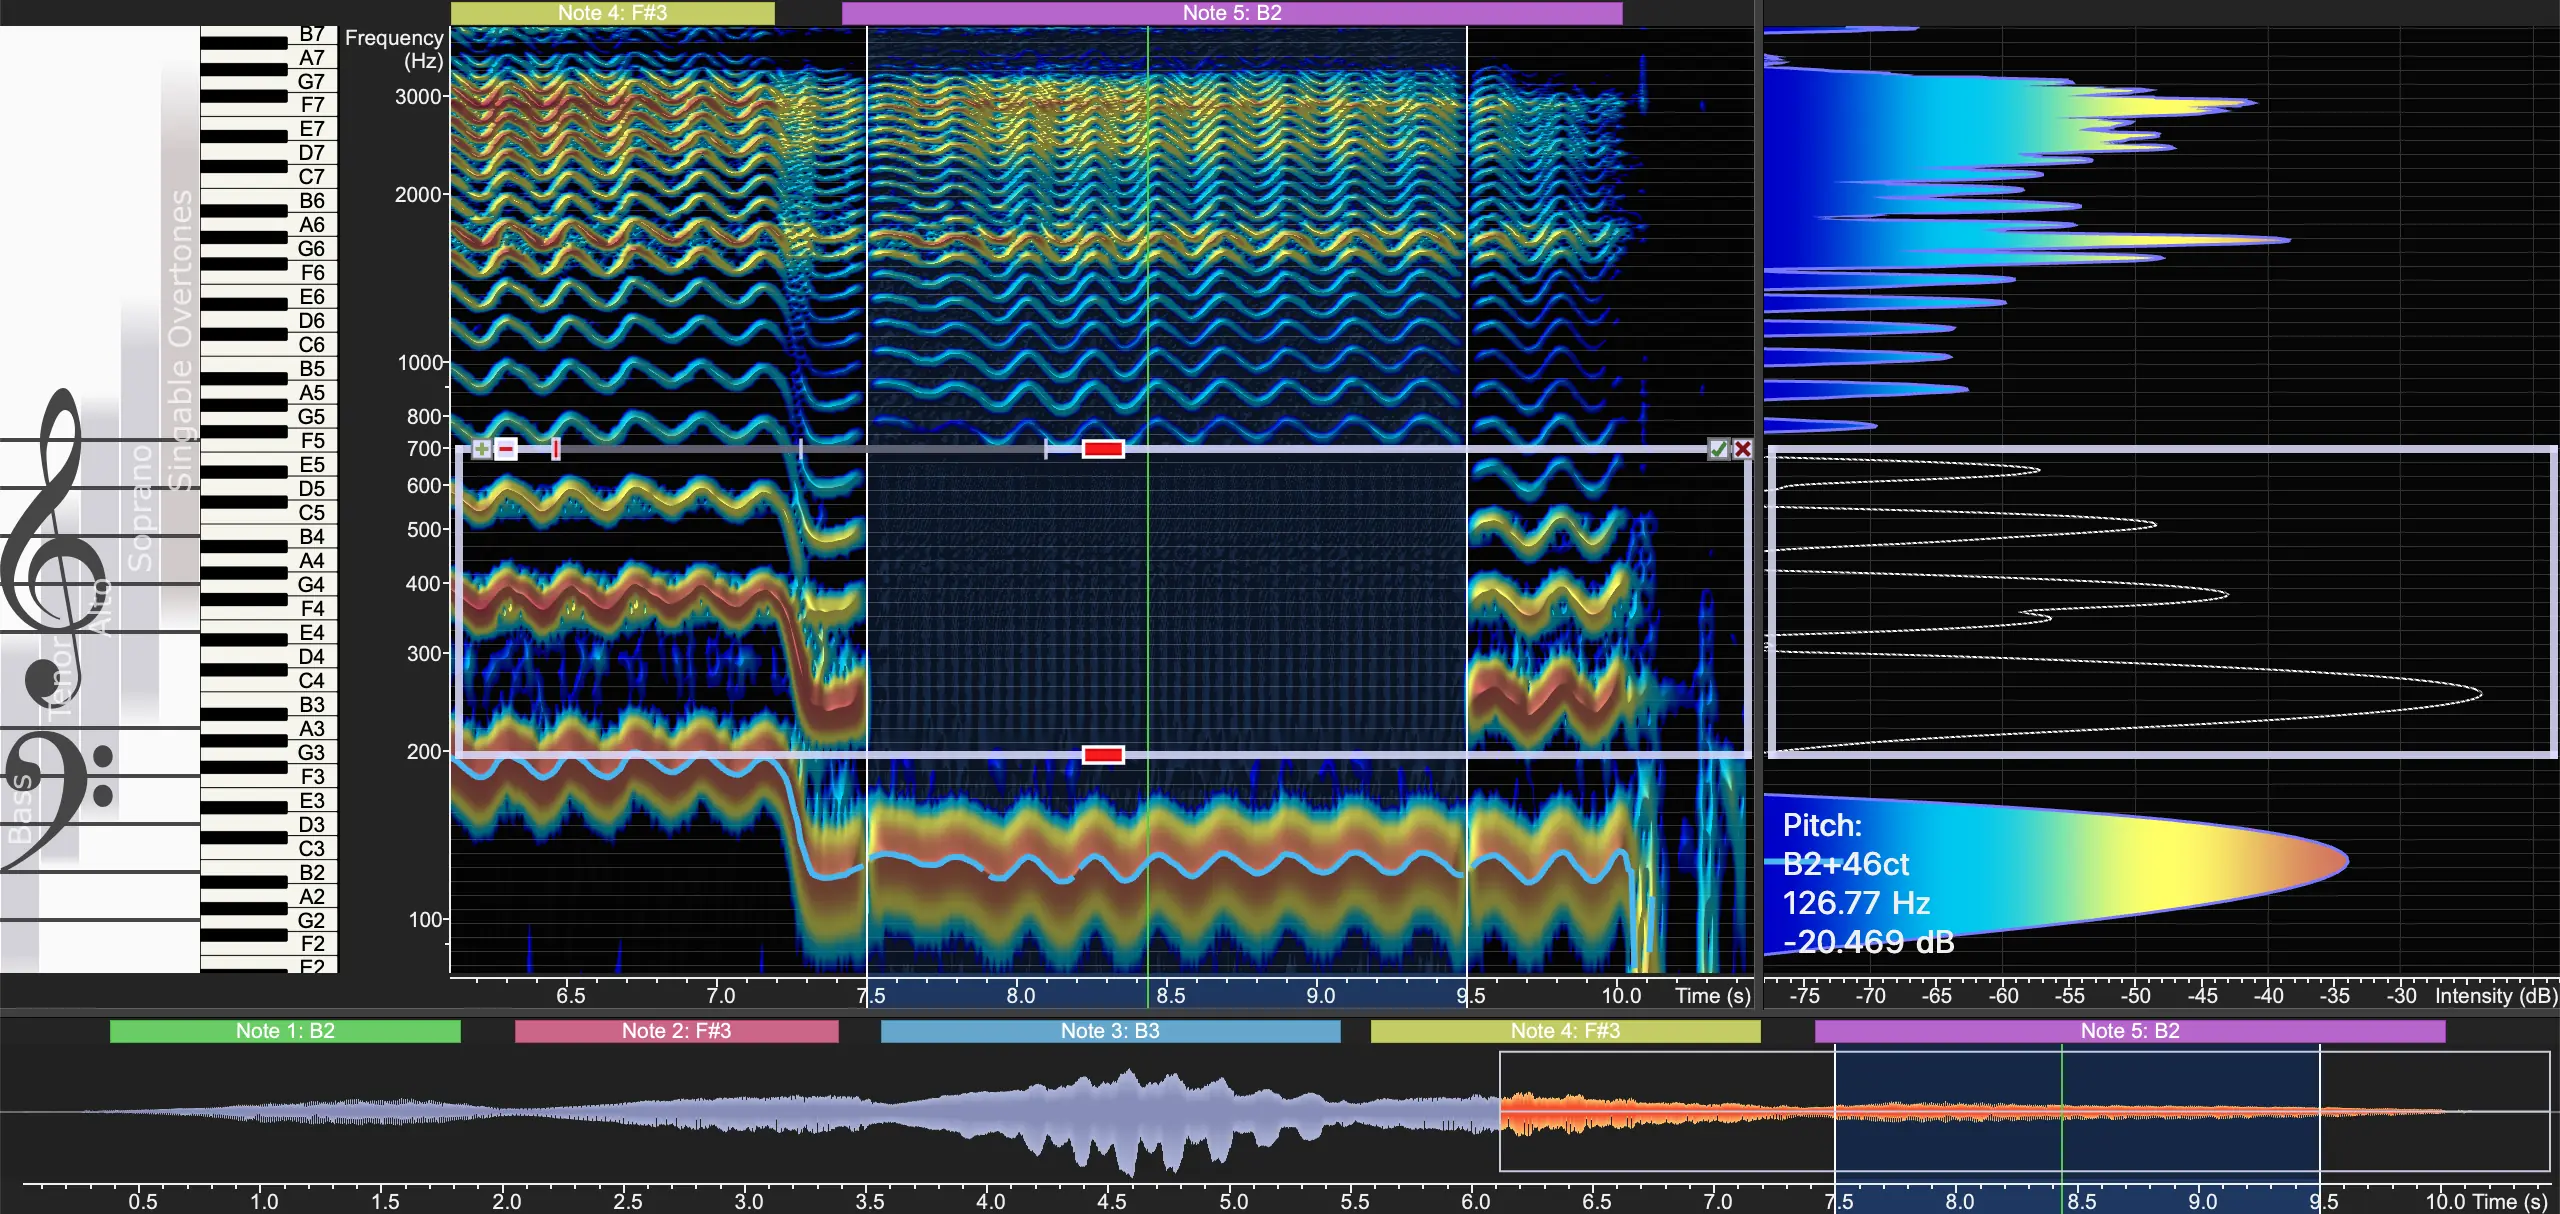
Notice in Subtractive Frequency Filter how the Spectrum shows an outline of the second to fifth harmonics, while the other harmonics are in color. Once again, start playback, and move the filter up and down to hear its effect.
To remove the filter, click on the close button on its top right corner.
Note Slider
The Frequency Filter enables you to listen to the individual harmonics (or overtones) in a recording. A Note Slider is a complementary tool: it gives you a visual reference for a specific note or frequency, lets you count the harmonics that theoretically belong to that fundamental, and shows which note name and frequency they correspond to.
| Note Sliders were called Overtone Sliders in earlier versions. |
To add Note Sliders, first click on Settings Profiles on the toolbar and select the Single Row Toolbar profile. This will introduce a few new items on the toolbar. The two we are interested in now are the edit field for the number of Note Sliders, and the menu button to set the snap mode:
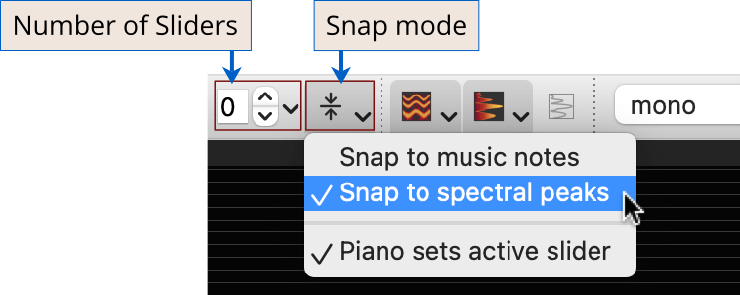
Each slider has a fundamental frequency and could be interpreted as a musical note, and it can show the over- and undertones corresponding to this frequency.
The Snap Mode determines what happens when you move the slider. If snapping is off, it will move freely. If snapping is enabled, the slider will snap to the nearest musical note on the piano, or the nearest peak in the spectrum. Snapping to a musical note would be used if you want to set the note that you want to sing, and snapping to the spectral peak would allow you to measure what you actually sung.
Set the Number of Sliders edit field on the toolbar to "1". This will add a single slider overlay on the screen. Click on the red line of the slider and drag it up and down.
Click on the icon of the Snap mode button to enable snapping. Then click on the down arrow on the right side of the button to open the button menu and switch between snapping to musical notes and spectral peaks. Observe how these actions change the behaviour of the slider line when you move it up and down.
Now position the green time cursor line in the middle of Note 5 (at around 8.5 s) to set the spectrum to that position. Then move the slider on the Short-Term view to align with the lowest harmonic. Now point at the right upward facing triangle of the slider and drag it all the way up. Your Short-Term view should now look something like this:
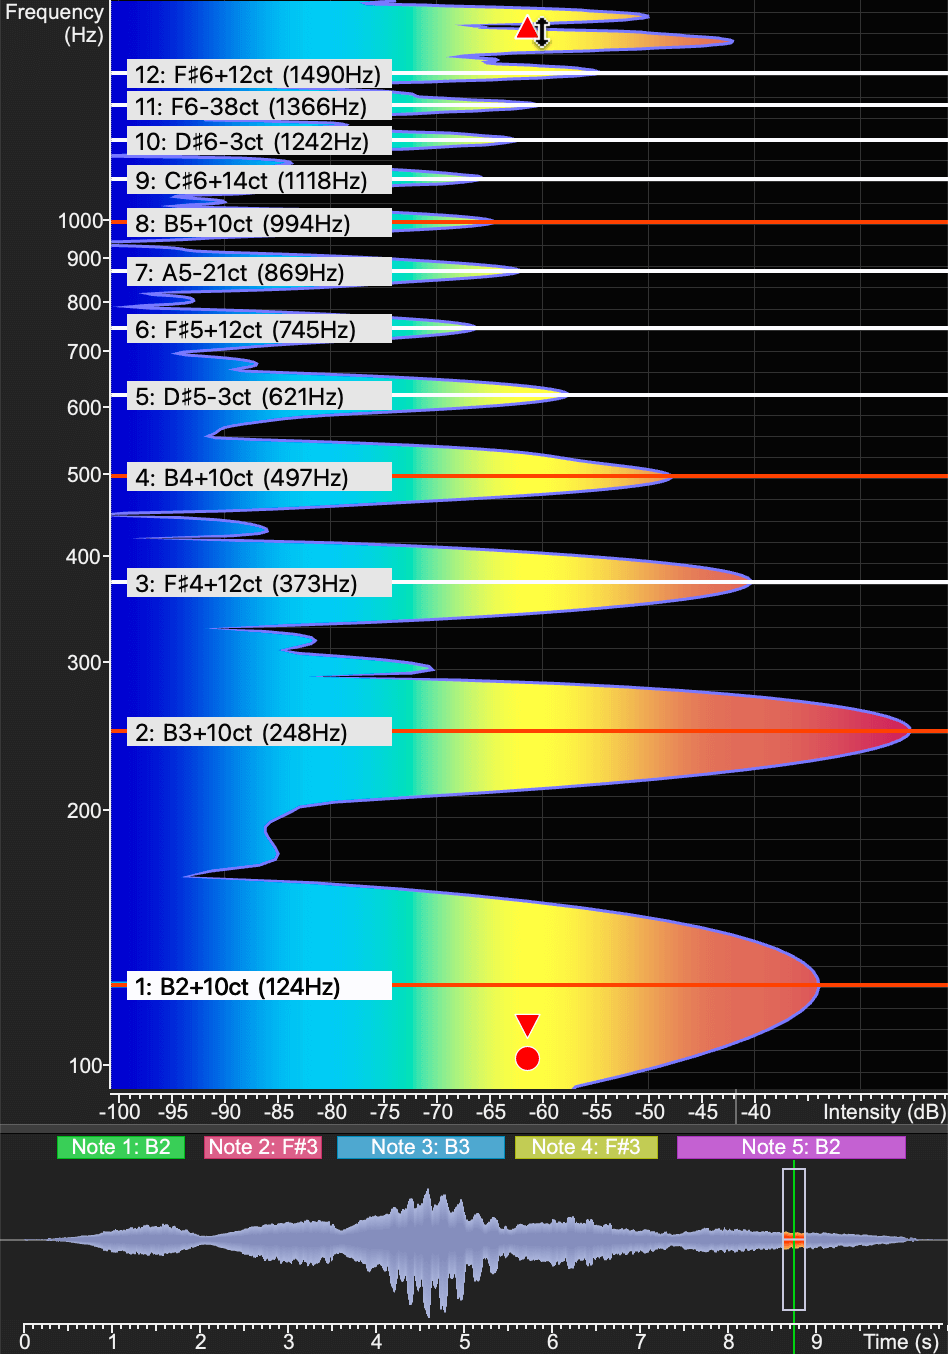
You can scroll down the Frequency Scale and zoom it slightly until you see enough detail of the Note Slider. The slider gives you a theoretical view of the overtones that belong to a particular sound. The labels of the slider lines show the number of the harmonic, its music note, and its frequency. The underlying Spectrogram shows the harmonics that are actually present in the recording. Click on the labels of the Note Slider and move the mouse up and down while holding the mouse button to hear the overtone scale belonging to the current fundamental pitch. Compare this to the actual overtones in the sound that you could hear with the Frequency Filter.
Summary
This concludes this quickstart guide. You have learned the basics of how to record and visualize sounds with VoceVista and had an introduction to the basic features and interface elements of the program. The main steps to remember are:
-
Select the microphone to be used by right-clicking on the Input Volume control on the toolbar.
-
Press Ctrl+Space or R on your keyboard to start the recording. Space will start playback or stop the current recording or playback.
-
Always monitor the input volume during recording to prevent clipping.
-
Use the pointer on the Frequency Scale and Time Scale for scrolling and zooming. Click & drag to scroll; use the mouse wheel or the 1 and 2 keys for zooming.
-
The Long-Term view shows a time range with the Spectrogram and/or fundamental pitch. The Short-Term view shows a detailed close-up of the time where the cursor is in the Long-Term view.
-
Make a time selection by clicking and dragging on the Spectrogram while pressing the Command key on Mac, or the Control key on PC. The selection will be played in a loop if looping is enabled.
-
The Spectrum shows the intensity (or volume) of the individual frequency components of a sound. The Spectrogram shows how the Spectrum changes over time.
-
Adjust the brightness and contrast sliders on the toolbar to show the desired amount of detail in the Spectrogram and Spectrum.
-
The Frequency Filter can filter out individual harmonics or frequency ranges and allows to listen to them individually, or to remove them.
-
Use a Note Slider to count and hear the theoretical harmonics that belong to a particular tone.
Next Steps
For a more detailed description of the interface elements introduced here, have a look at the chapter User Interface in the Reference Guide.